Free Access
Fig. 1.
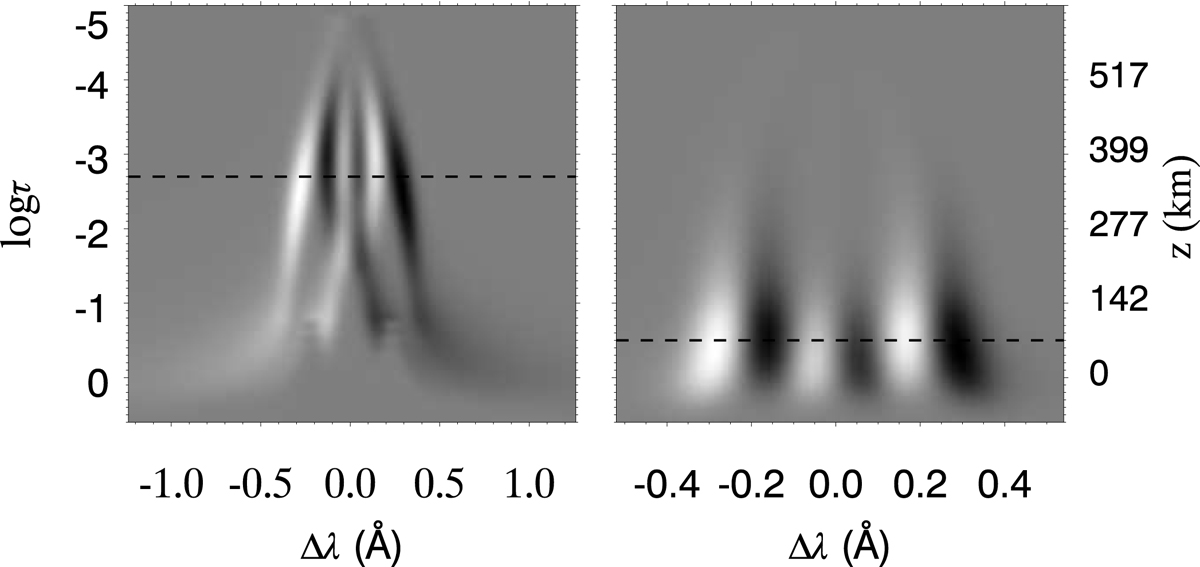
Response functions of the intensity to the velocity of the Si I 10 827 Å (left panel) and Ca I 10 839 Å (right panel) lines in the average umbral atmosphere. Horizontal dashed lines indicate the optical depth selected for the analysis of the velocity from each line.
Current usage metrics show cumulative count of Article Views (full-text article views including HTML views, PDF and ePub downloads, according to the available data) and Abstracts Views on Vision4Press platform.
Data correspond to usage on the plateform after 2015. The current usage metrics is available 48-96 hours after online publication and is updated daily on week days.
Initial download of the metrics may take a while.