Fig. 7.
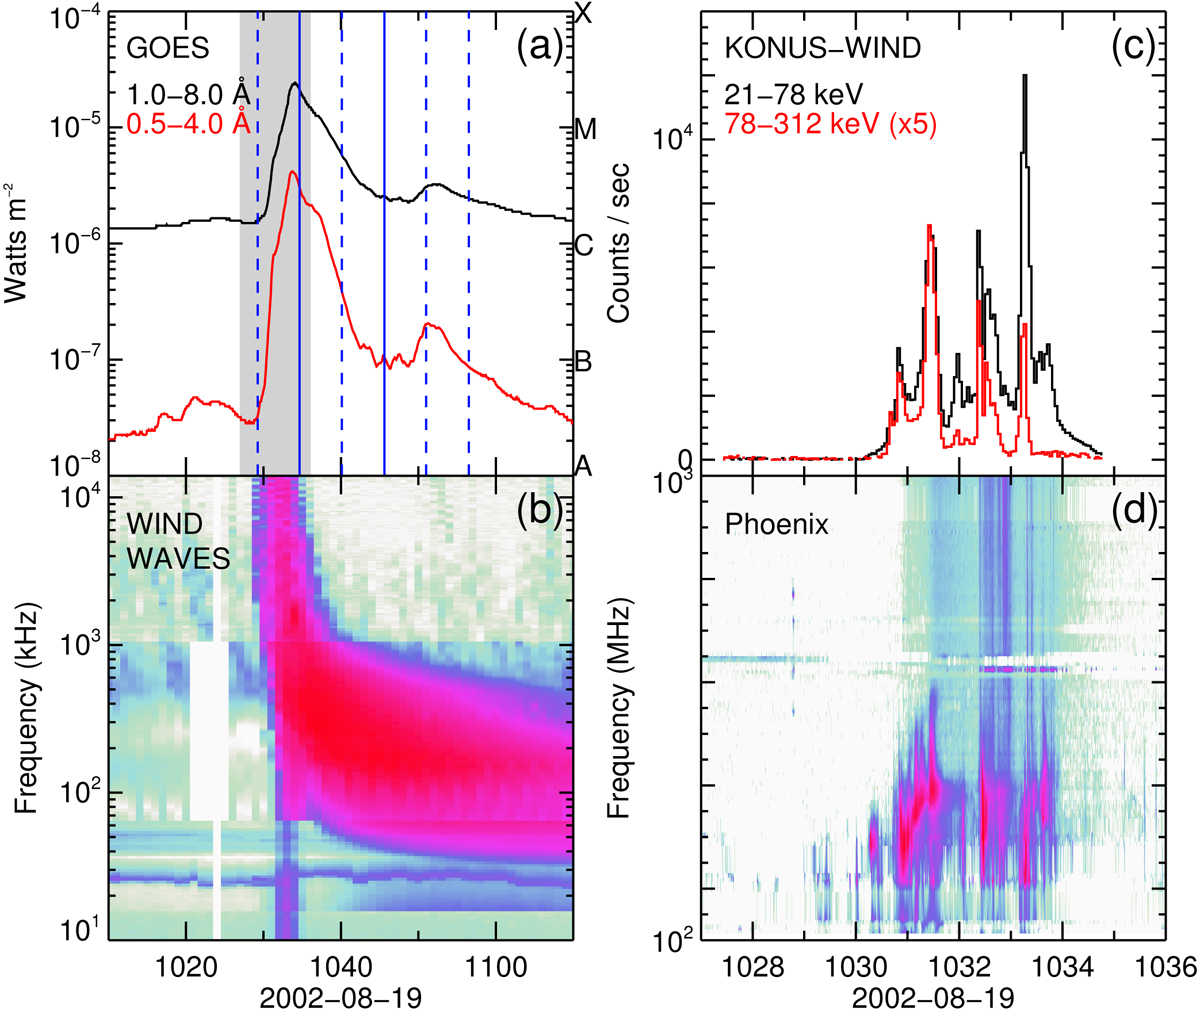
Panel a: full-disk GOES-10 3 s X-ray fluxes. The labels A, B, C, M, and X on the right y-axis indicate flare classes in the 1–8 Å channel. The vertical lines mark the start times of six CDS rasters; two solid vertical lines indicate the starts of the rasters when the excess line broadening is observed. Panel b: Wind WAVES 1 min averaged radio spectra. Panel c: full-disk Wind KONUS 3 s averaged X-ray counts−1 in a 9-min period marked by the shaded bar in panel a. The 78–312 keV fluxes are multiplied by a factor of 5. Panel d: Phoenix 100 ms radio spectra.
Current usage metrics show cumulative count of Article Views (full-text article views including HTML views, PDF and ePub downloads, according to the available data) and Abstracts Views on Vision4Press platform.
Data correspond to usage on the plateform after 2015. The current usage metrics is available 48-96 hours after online publication and is updated daily on week days.
Initial download of the metrics may take a while.