Fig. 6.
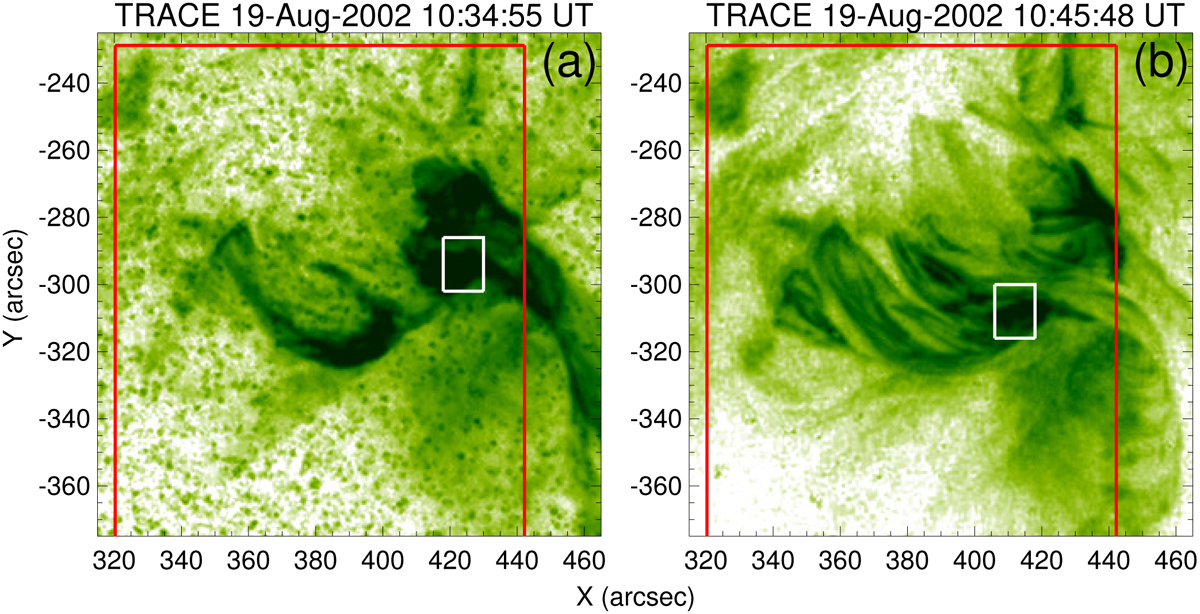
TRACE 195 Å EUV direct images (in reverse color-scale, where dark corresponds to high intensities) of the source M2.1 flare in event 2 around the flare maximum (panel a) and ten minutes later (panel b). The red rectangles depict the CDS FOV. White rectangles mark pixels with enhanced line broadenings. Panel a shows the EIT flare in Fig. 1b at higher resolution. The noise spikes in the images are not filtered out.
Current usage metrics show cumulative count of Article Views (full-text article views including HTML views, PDF and ePub downloads, according to the available data) and Abstracts Views on Vision4Press platform.
Data correspond to usage on the plateform after 2015. The current usage metrics is available 48-96 hours after online publication and is updated daily on week days.
Initial download of the metrics may take a while.