Free Access
Fig. 5.
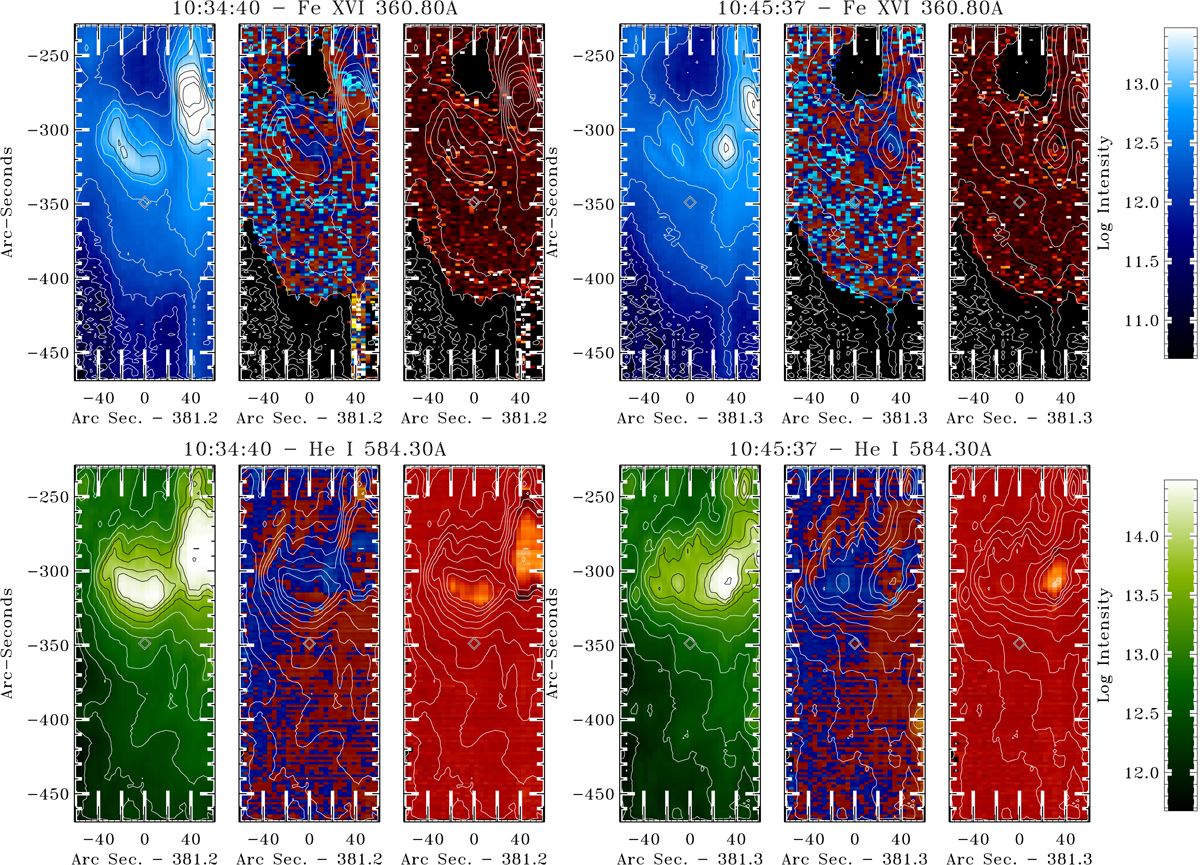
Similar to Fig. 3, but the CDS rasters depict the Fe XVI 360.80 Å (top row) and He I 584.30 Å (bottom row) lines at 10:34:40 UT and 10:45:37 UT on 2002 August 19. Places in the Fe XVI image that were below a certain intensity threshold have not been fit. The velocity and FWHM panels use the same color tables as Fig. 3.
Current usage metrics show cumulative count of Article Views (full-text article views including HTML views, PDF and ePub downloads, according to the available data) and Abstracts Views on Vision4Press platform.
Data correspond to usage on the plateform after 2015. The current usage metrics is available 48-96 hours after online publication and is updated daily on week days.
Initial download of the metrics may take a while.