Fig. 4.
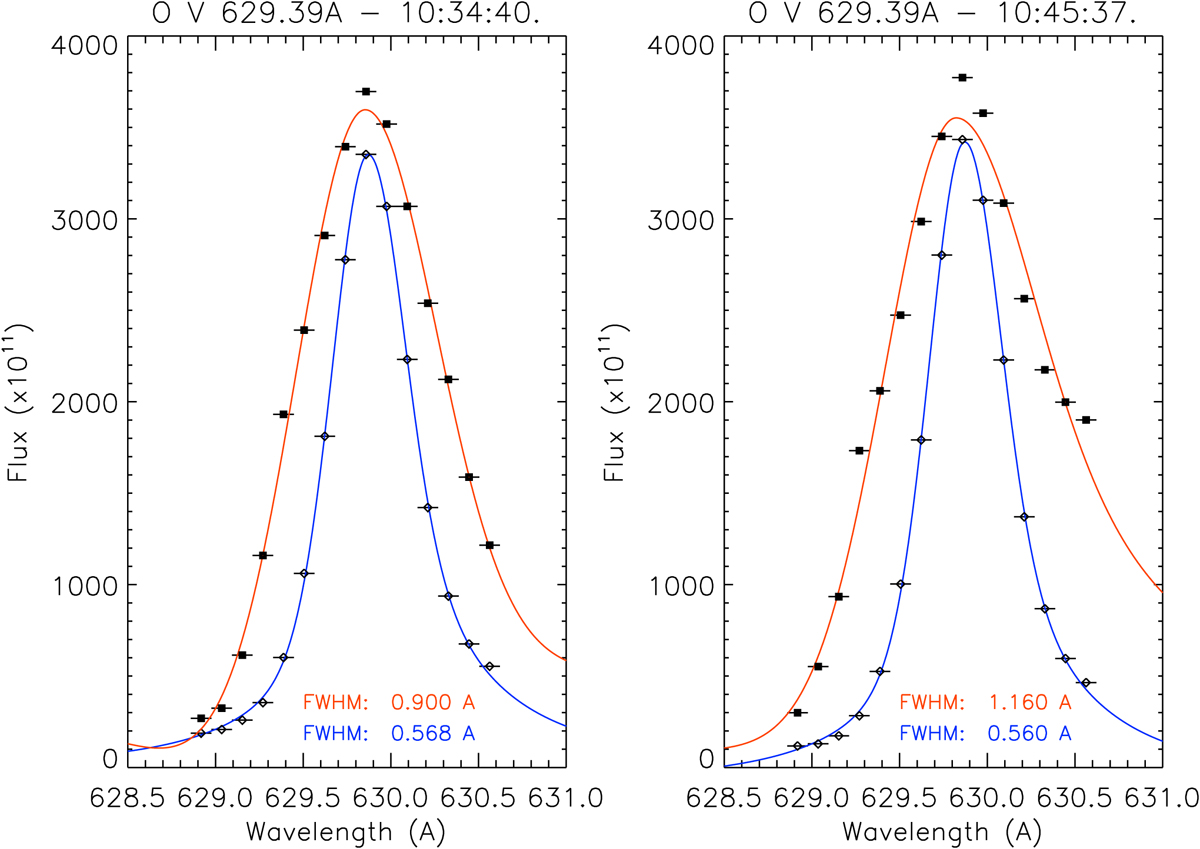
Left: broadened Gaussian fits to the O V intensity (photons s−1 cm−2 sr−1) from the pixel (420″, −290″; red curve) and to the intensity summed over 90 pixels (to obtain a similar level of counts) around (370″, −420″; blue curve) at 10:34:40 UT on August 19. Right: similar to the left panel, but at 10:45:37 UT on August 19, and the red curve shows the pixel (410″, −310″).
Current usage metrics show cumulative count of Article Views (full-text article views including HTML views, PDF and ePub downloads, according to the available data) and Abstracts Views on Vision4Press platform.
Data correspond to usage on the plateform after 2015. The current usage metrics is available 48-96 hours after online publication and is updated daily on week days.
Initial download of the metrics may take a while.