Fig.3.
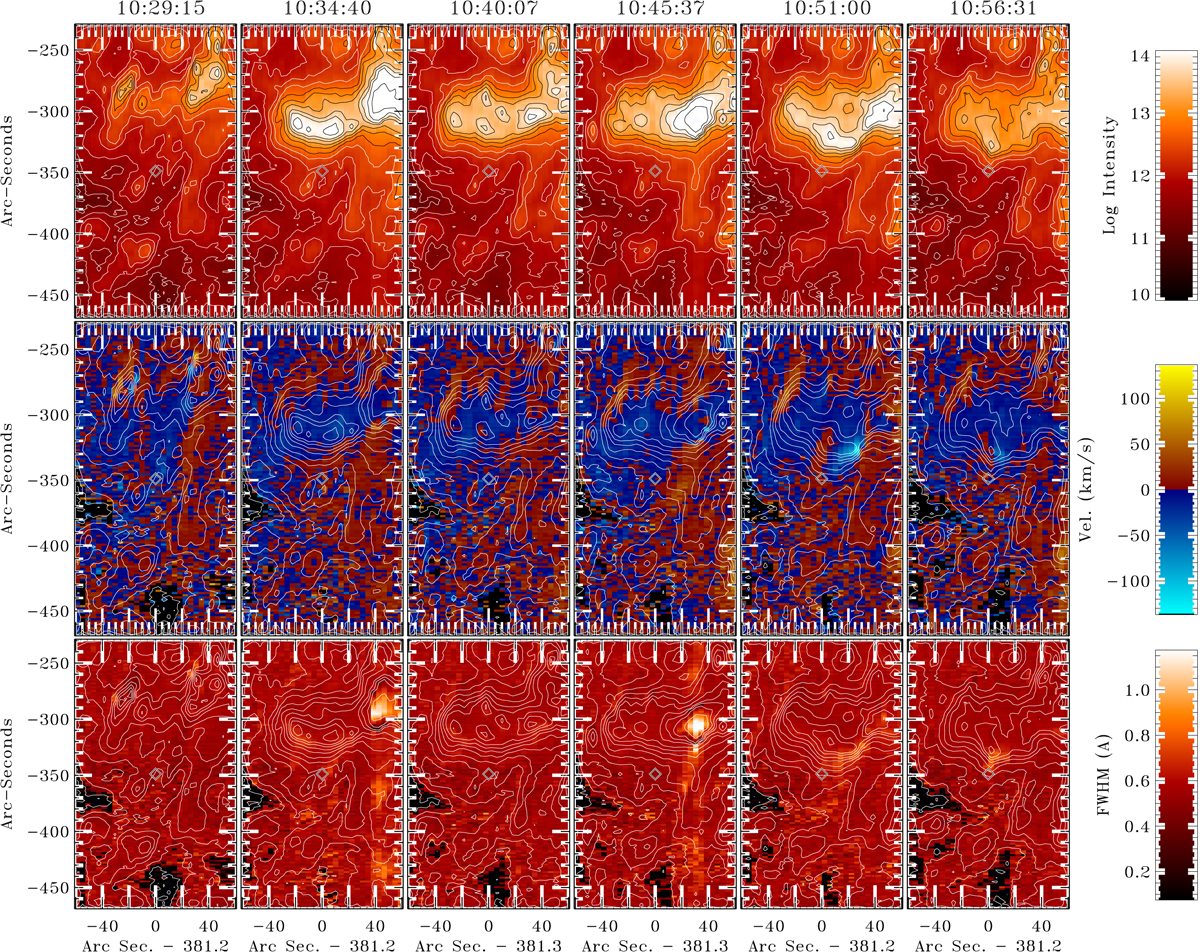
CDS rasters (O V 629.39 Å line) of the source flare in event 2 between 10:29:15 and 10:56:31 UT on 2002 August 19. Times are given for the beginning of the rastering. Top row: intensity (photons s−1 cm−2 sr−1). Middle row: wavelength shift relative to the median wavelength taken from the full image. Bottom row: FWHM of the line. The contours for every 0.25 of log10 intensity are overplotted.
Current usage metrics show cumulative count of Article Views (full-text article views including HTML views, PDF and ePub downloads, according to the available data) and Abstracts Views on Vision4Press platform.
Data correspond to usage on the plateform after 2015. The current usage metrics is available 48-96 hours after online publication and is updated daily on week days.
Initial download of the metrics may take a while.