Free Access
Fig. 2.
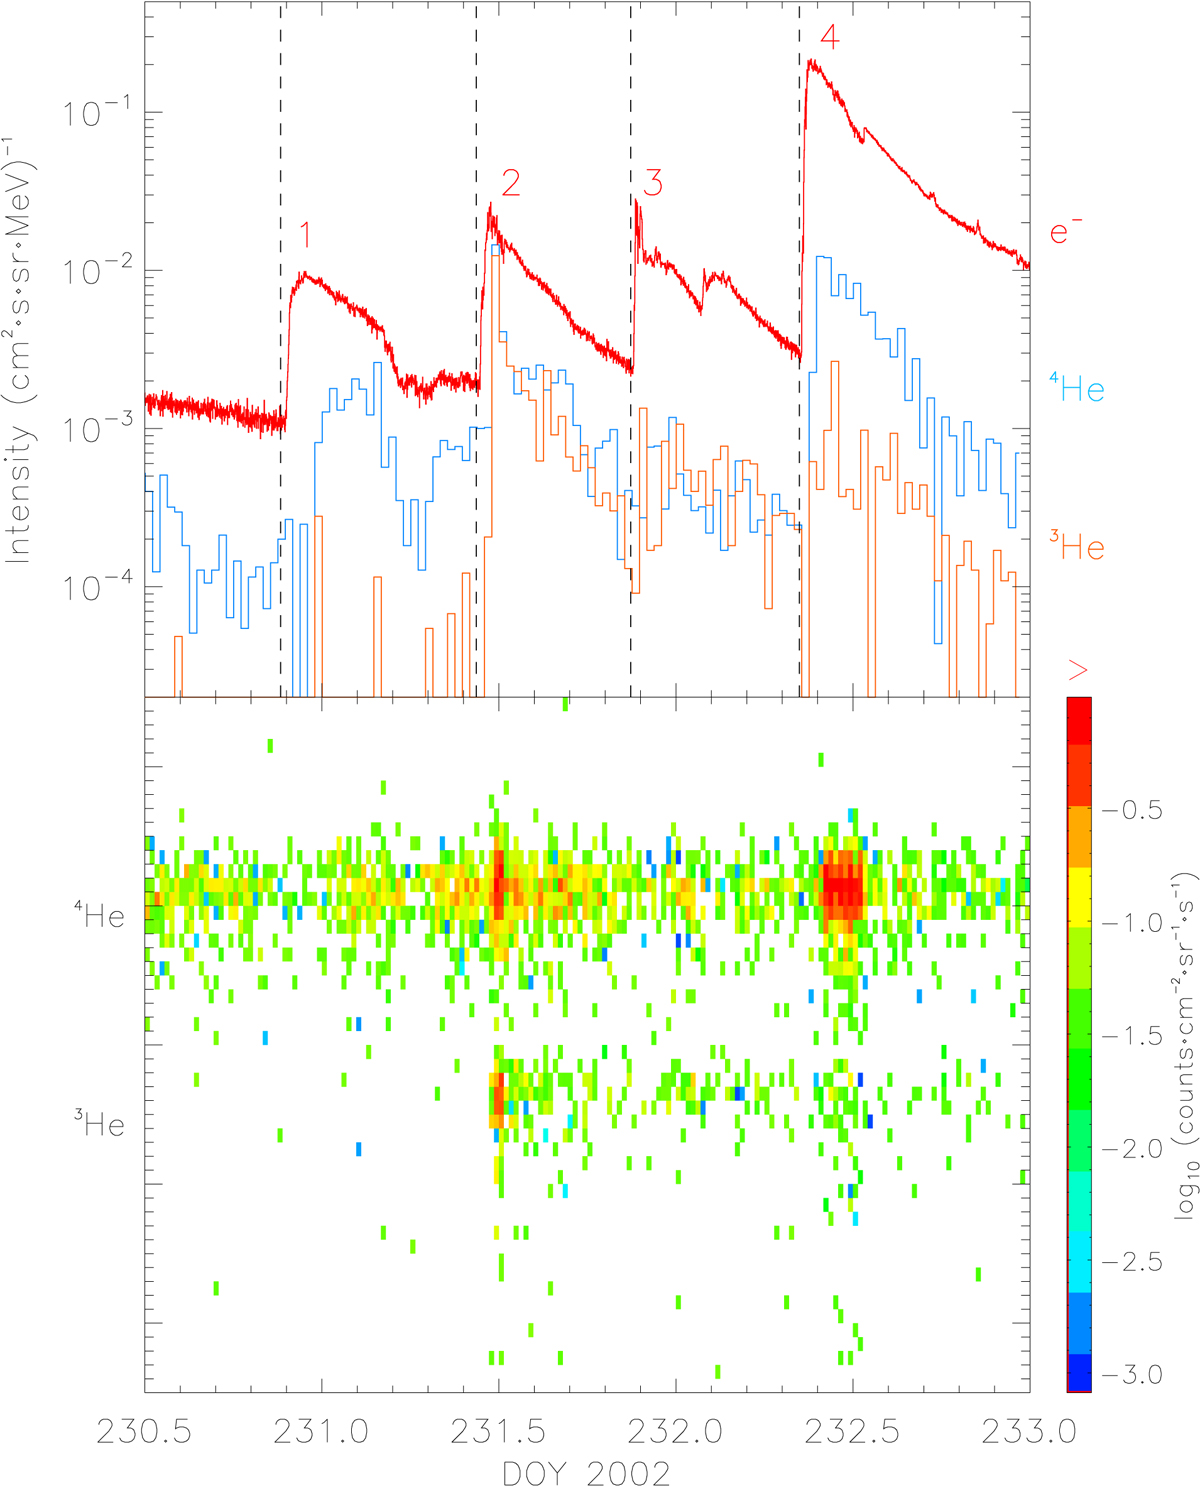
SOHO EPHIN measurements. Top: 1 min averaged 0.7–3.0 MeV electron intensity (divided by 500) and 30 min averaged 10–25 MeV nucleon−13He, 4He intensities. Dashed vertical lines indicate X-ray flares associated with events 1–4 (see Table 1). Bottom: helium mass spectrogram of individual PHA ions with no energy restriction.
Current usage metrics show cumulative count of Article Views (full-text article views including HTML views, PDF and ePub downloads, according to the available data) and Abstracts Views on Vision4Press platform.
Data correspond to usage on the plateform after 2015. The current usage metrics is available 48-96 hours after online publication and is updated daily on week days.
Initial download of the metrics may take a while.