Fig. 1.
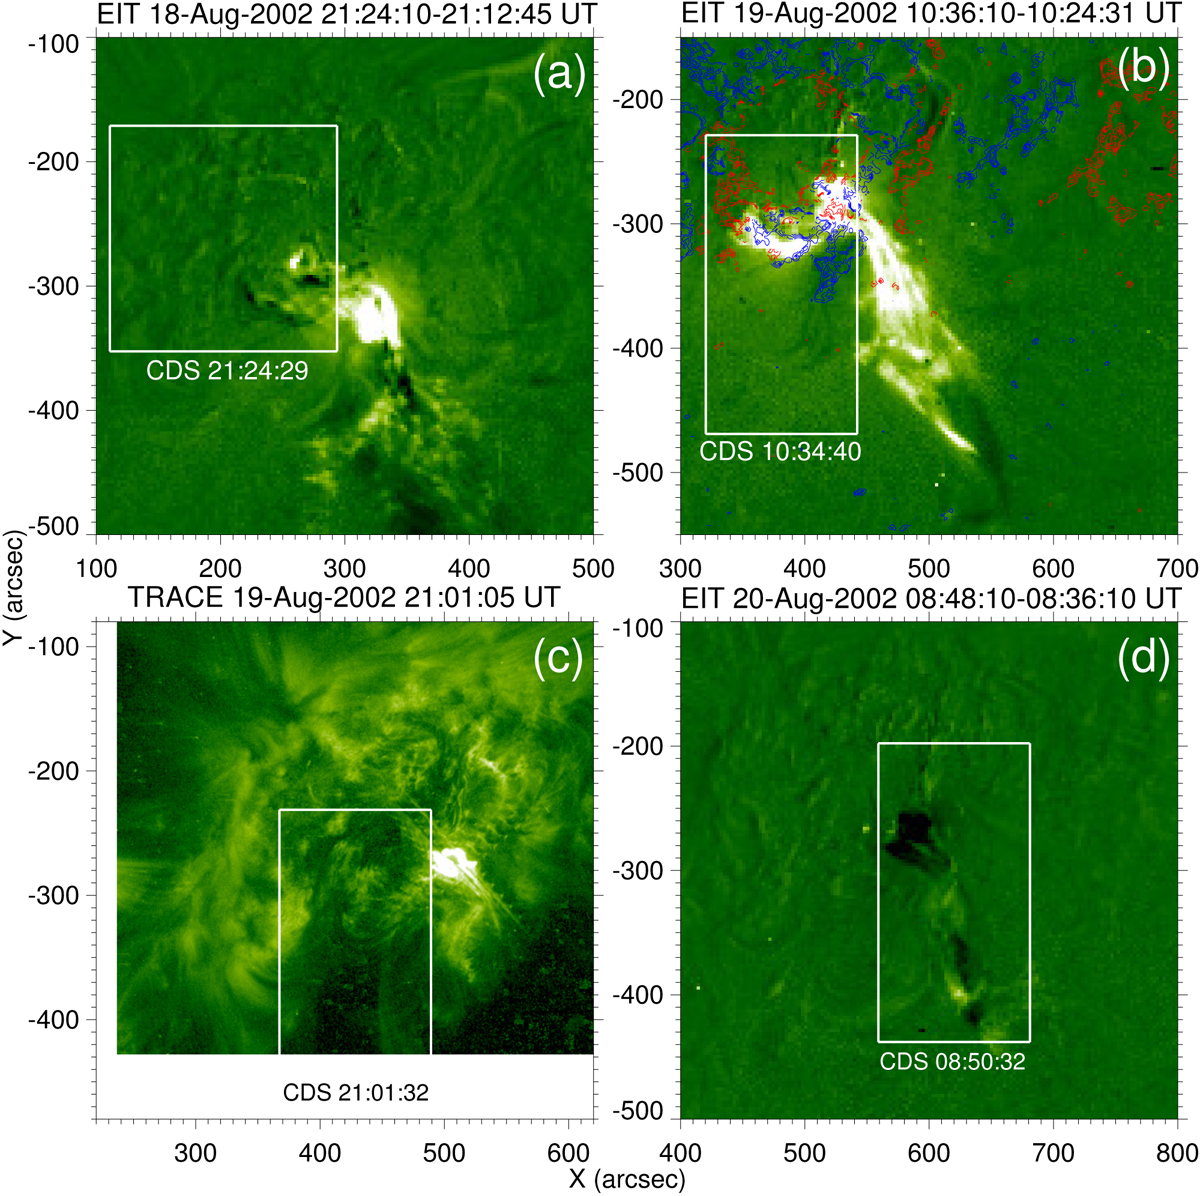
SOHO EIT 195 Å EUV 12 min running-differences images for flares in event 1 (panel a), event 2 (panel b), and event 4 (panel d). Over-plotted in panel b are ±500 G SOHO MDI magnetogram data contours for 2002 August 19 11:11 UT, where blue and red show positive and negative polarity. TRACE 195 Å EUV direct image (rescaled to L1 and aligned with the CDS Fe XVI 360.80 Å line raster image) for event 3, for which SOHO EIT data are not available (panel c). The empty area at the bottom of (panel c) is due to the restricted TRACE FOV. White rectangles depict the CDS FOV. While the images in events 1, 2, and 3 are near (±1−2 min) the flare maximum, the image in event 4 is taken ~20 min after the flare maximum.
Current usage metrics show cumulative count of Article Views (full-text article views including HTML views, PDF and ePub downloads, according to the available data) and Abstracts Views on Vision4Press platform.
Data correspond to usage on the plateform after 2015. The current usage metrics is available 48-96 hours after online publication and is updated daily on week days.
Initial download of the metrics may take a while.