Fig. 8.
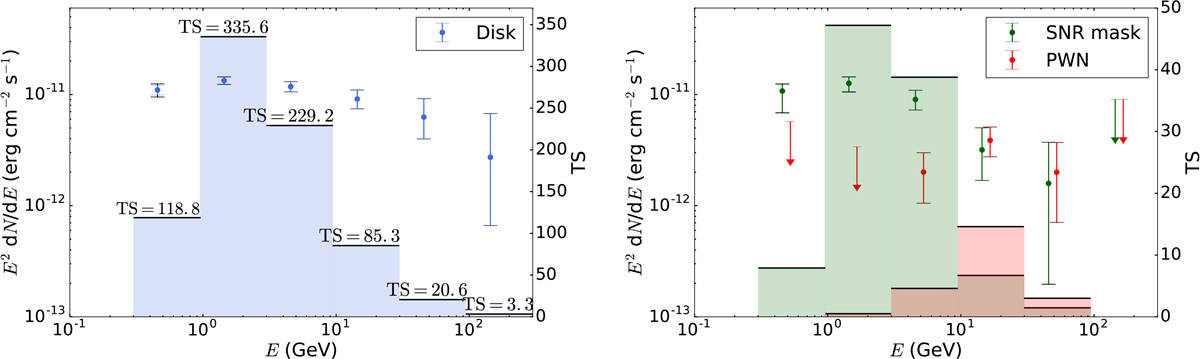
SED (data points) and TS values (shaded areas) in individual energy bands using the uniform disk model (left) and using the SNR mask and the radio PWN model (right). The colored bars are the statistical uncertainties, and the black bars correspond to the quadratic sums of statistical and systematic errors (the difference is only visible in the first energy band). The systematic errors are calculated using eight alternative Galactic diffuse emission models.
Current usage metrics show cumulative count of Article Views (full-text article views including HTML views, PDF and ePub downloads, according to the available data) and Abstracts Views on Vision4Press platform.
Data correspond to usage on the plateform after 2015. The current usage metrics is available 48-96 hours after online publication and is updated daily on week days.
Initial download of the metrics may take a while.