Fig. 4.
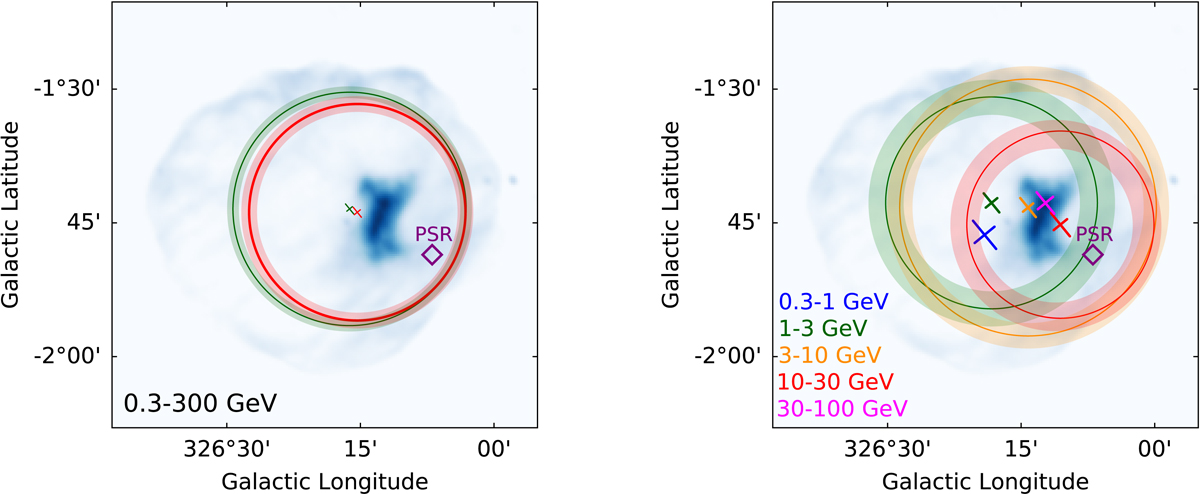
Left: best-fit extended source from 300 MeV to 300 GeV for a uniform disk hypothesis (green) and a 2D symmetric Gaussian (red), plotted in the MOST radio image. The crosses are the centroid uncertainties (1σ), the solid circles correspond to the r68 of the uniform disk, and the Gaussian template and the shaded areas are the 1σ error on size. The putative position of the pulsar is represented by a diamond. Right: bestfit Gaussian or point source in five energy bands. The crosses are the centroid and the position uncertainties (1σ). If the source is significantly extended (see Fig. 5), the r68 of the Gaussian is depicted by a solid circle with the associated errors (shaded areas), otherwise the best-fit point source is represented.
Current usage metrics show cumulative count of Article Views (full-text article views including HTML views, PDF and ePub downloads, according to the available data) and Abstracts Views on Vision4Press platform.
Data correspond to usage on the plateform after 2015. The current usage metrics is available 48-96 hours after online publication and is updated daily on week days.
Initial download of the metrics may take a while.