Fig. 3.
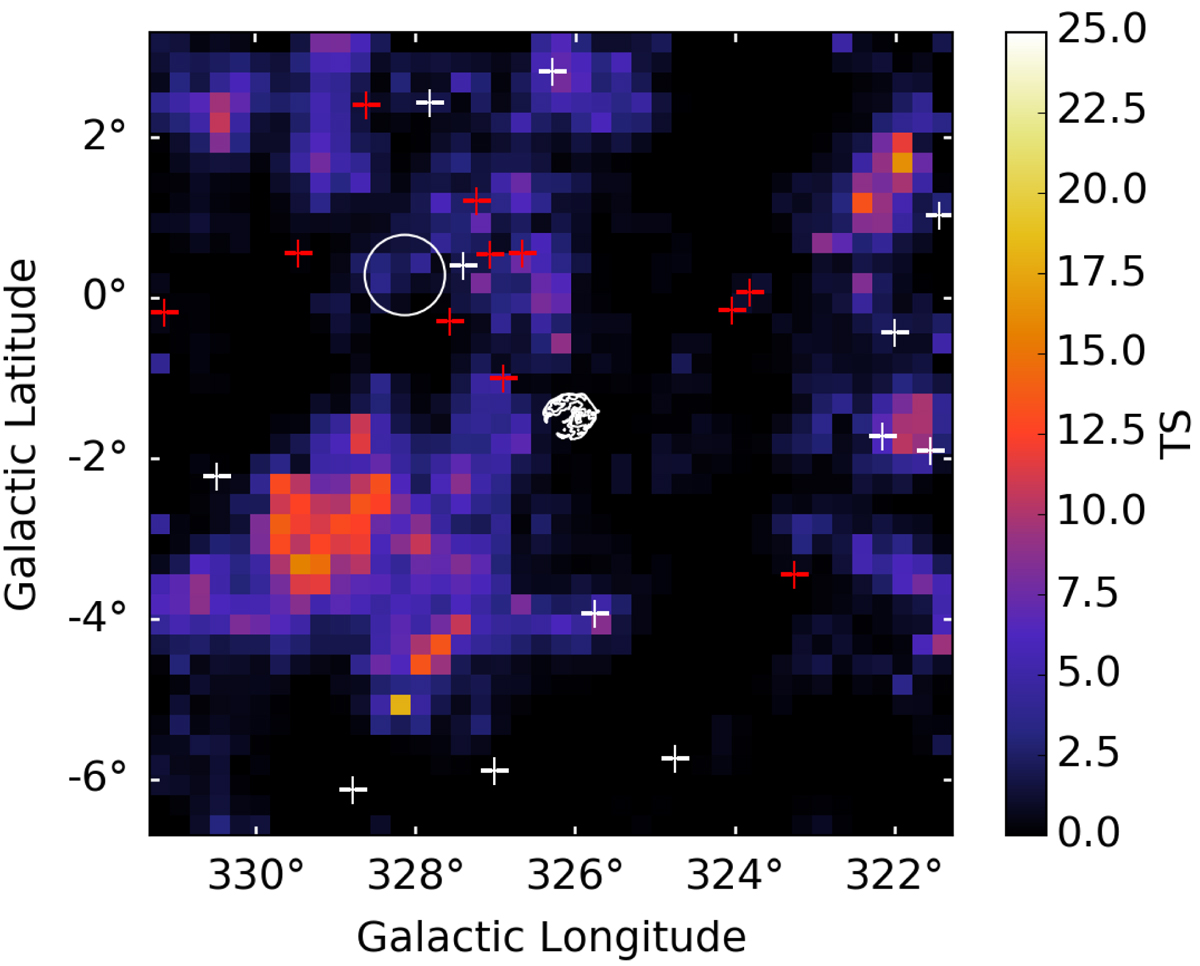
Residual TS map from 300 MeV to 300 GeV of a 10° × 10° region centered on the SNR and using the PSF3 events. The pixel size is 0.25° and the radio contours of the SNR are overlaid in white. The white circle is an FGES extended source. The white crosses are the 3FGL point sources and the red crosses are the sources we added to the model.
Current usage metrics show cumulative count of Article Views (full-text article views including HTML views, PDF and ePub downloads, according to the available data) and Abstracts Views on Vision4Press platform.
Data correspond to usage on the plateform after 2015. The current usage metrics is available 48-96 hours after online publication and is updated daily on week days.
Initial download of the metrics may take a while.