Fig. 9.
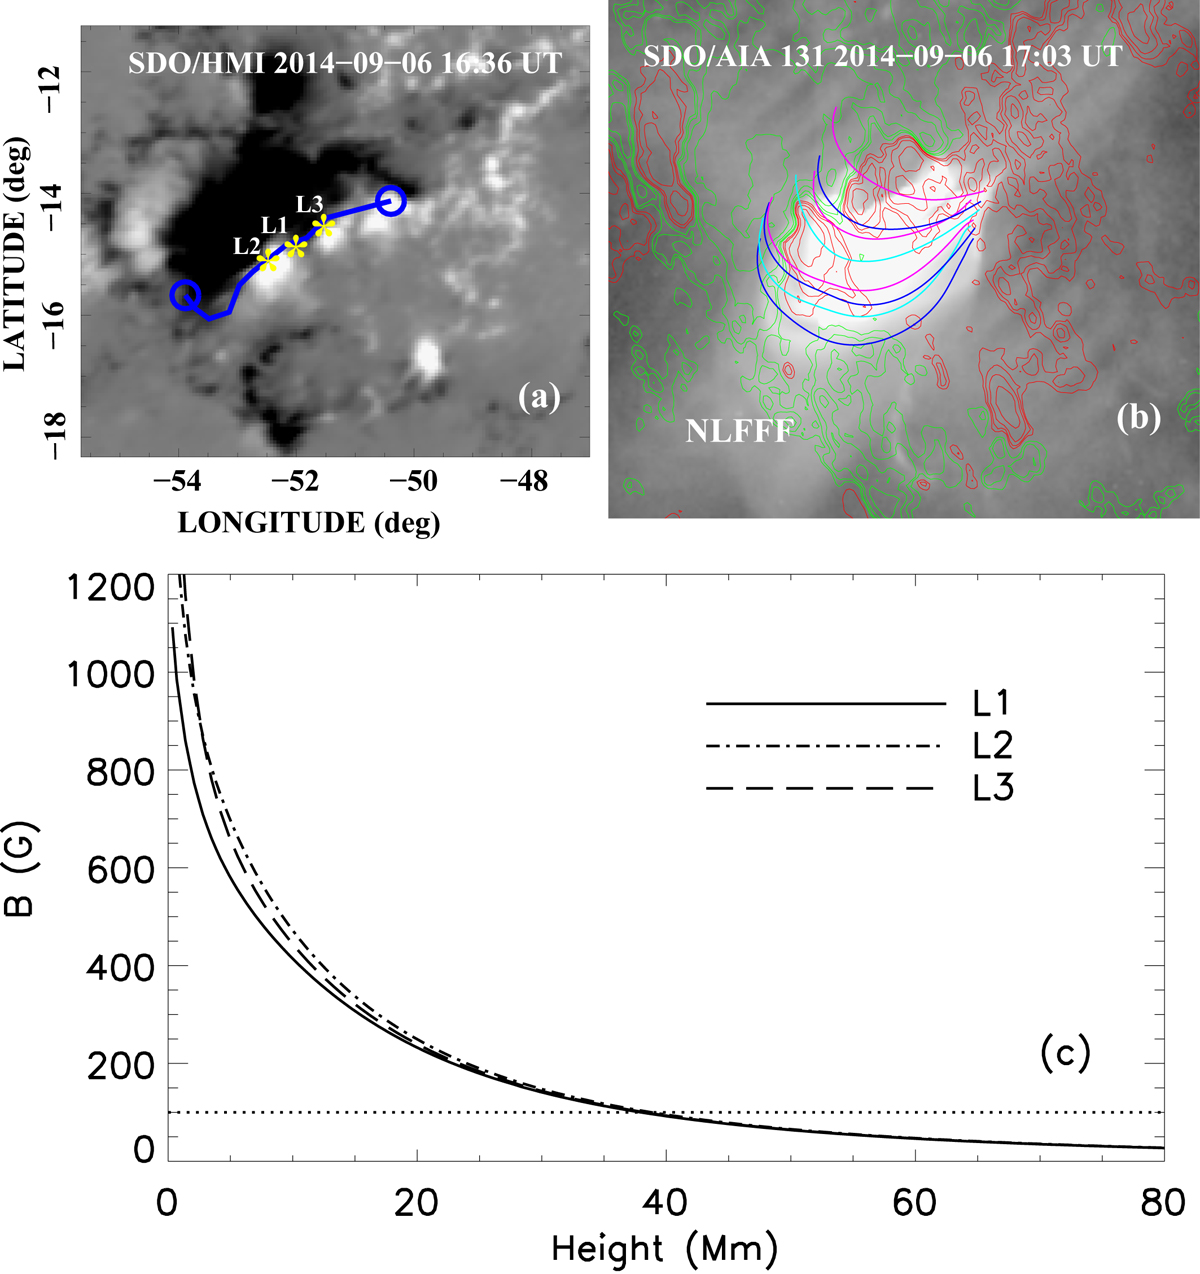
Magnetic field strength estimated from the NLFFF model. Panel a: zoomed view of the longitude–latitude map of the radial component of the photospheric magnetic field by SDO/HMI in the HIRES region at 16:36 UT on 2014 September 6. The blue curve with circles at the two ends refers to the path along which we insert the flux rope. Panel b: selected field lines from the NLFFF model overlaid on a flare image by AIA, and the red (green) contours refer to the positive (negative) photospheric magnetic fields by HMI. Panel c: the distributions of the magnetic field strength from this model with height at three locations, L1, L2, and L3 (marked with yellow stars on panel a.
Current usage metrics show cumulative count of Article Views (full-text article views including HTML views, PDF and ePub downloads, according to the available data) and Abstracts Views on Vision4Press platform.
Data correspond to usage on the plateform after 2015. The current usage metrics is available 48-96 hours after online publication and is updated daily on week days.
Initial download of the metrics may take a while.