Fig. 4.
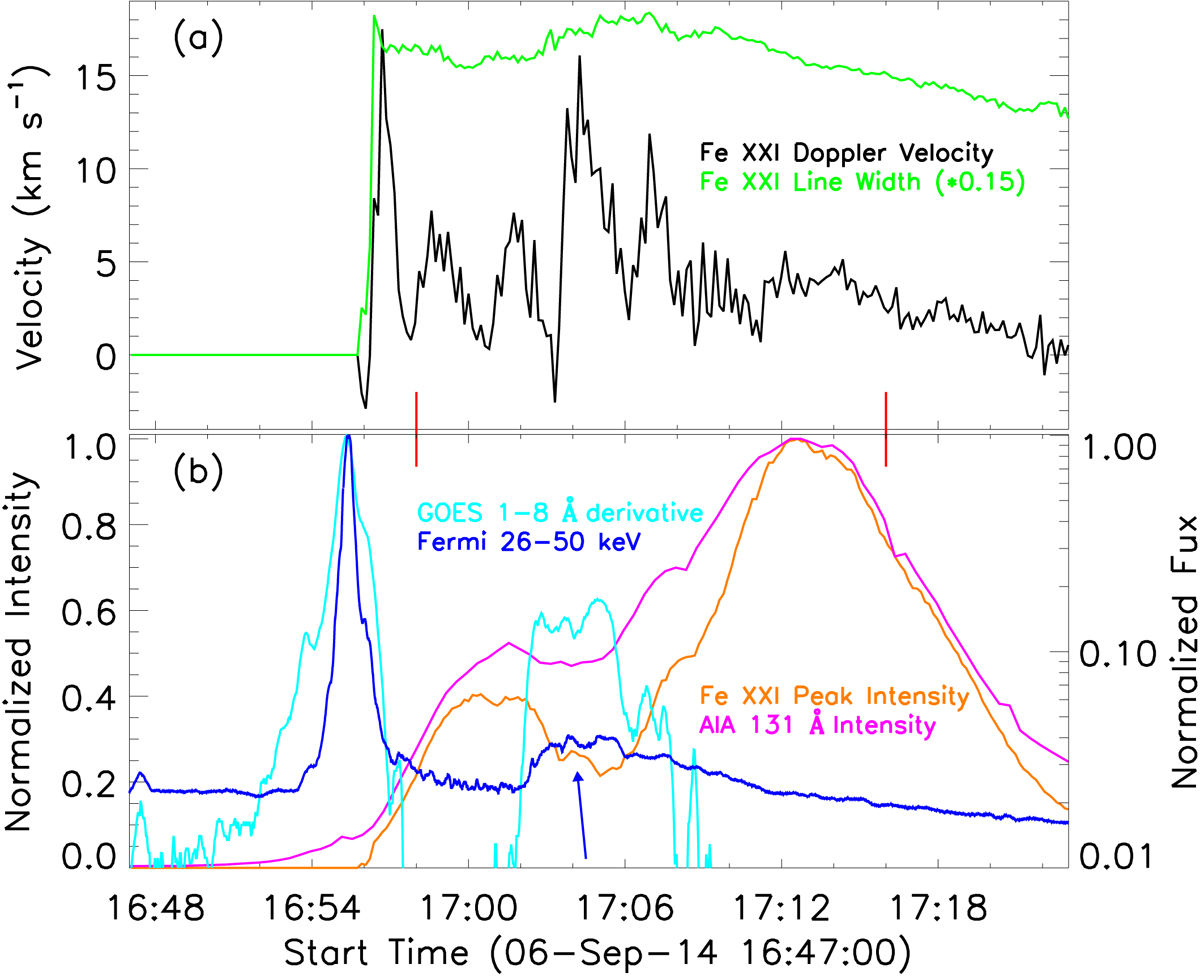
Time-evolution curves. Time series of Doppler velocity (black), line width (green), and peak intensity (orange) in Fe XXI 1354.08 Å, as well as the AIA 131 Å intensity (purple), the light curves in GOES 1−8 Å derivative (turquoise), and Fermi 26−50 keV (green). The blue arrow indicates a small HXR pulse, and two red vertical ticks outline the detrended time series in Fig. 5.
Current usage metrics show cumulative count of Article Views (full-text article views including HTML views, PDF and ePub downloads, according to the available data) and Abstracts Views on Vision4Press platform.
Data correspond to usage on the plateform after 2015. The current usage metrics is available 48-96 hours after online publication and is updated daily on week days.
Initial download of the metrics may take a while.