Fig. 2.
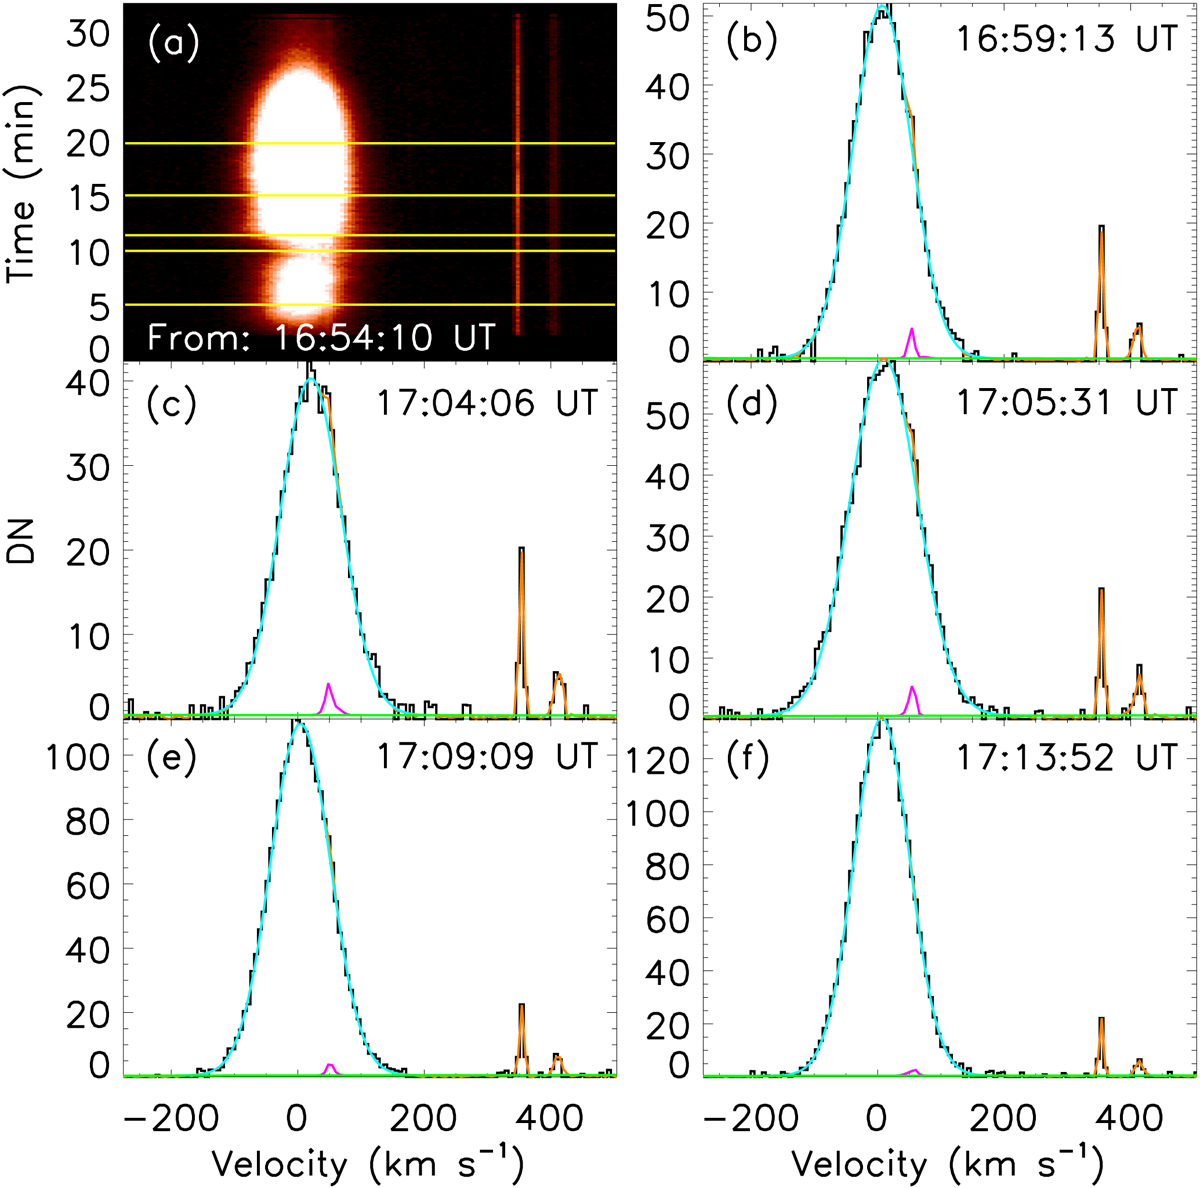
Flaring spectra observed by the IRIS. Panel a: time evolution of the line profiles in Fe XXI 1354.08 Å. Panels b−f: spectral line profiles (black) and their double Gaussian fitting results (orange) with a linear background (green) at the time indicated by the yellow lines in panel a. The turquoise line is Fe XXI 1354.08 Å, and the purple line is C i 1354.29 Å. The zero velocity is set to the rest wavelength of Fe XXI 1354.08 Å.
Current usage metrics show cumulative count of Article Views (full-text article views including HTML views, PDF and ePub downloads, according to the available data) and Abstracts Views on Vision4Press platform.
Data correspond to usage on the plateform after 2015. The current usage metrics is available 48-96 hours after online publication and is updated daily on week days.
Initial download of the metrics may take a while.