Fig. 2.
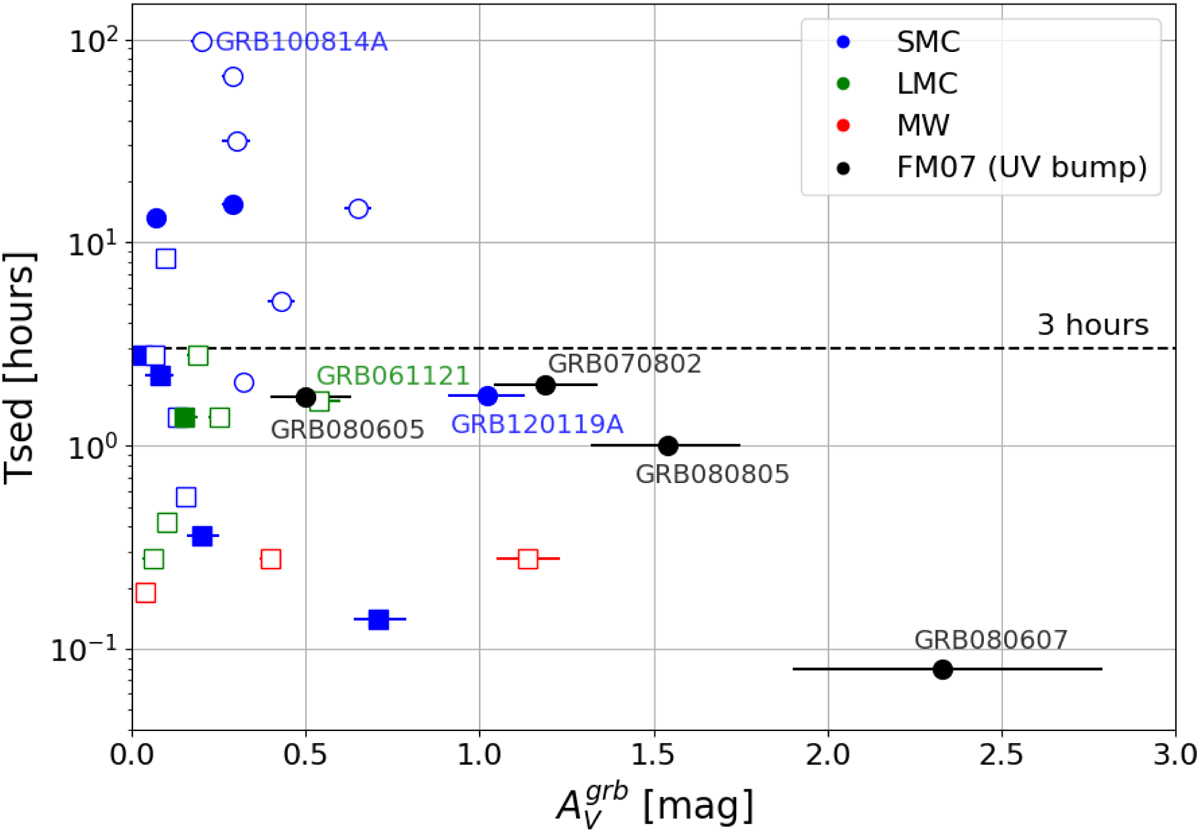
Time, since the GRB trigger, at which the SED were evaluated as a function of the extinction along the GRB l.o.s., ![]() . The blue, green and red colours represent which local extinction curve (SMC, LMC, MW) scaled the best to the data. The black colour means that the extinction curve was fitted with the FM07 and has a spectroscopically confirmed UV bump. The circles represent the afterglows with spectroscopic measurement and the squares the ones with photometric measurement only. The filled symbols represent SEDs best fitted with a single power law, the empty ones represent SEDs best fitted by a broken power law. Only the names of the GRB in our Golden sample are indicated.
. The blue, green and red colours represent which local extinction curve (SMC, LMC, MW) scaled the best to the data. The black colour means that the extinction curve was fitted with the FM07 and has a spectroscopically confirmed UV bump. The circles represent the afterglows with spectroscopic measurement and the squares the ones with photometric measurement only. The filled symbols represent SEDs best fitted with a single power law, the empty ones represent SEDs best fitted by a broken power law. Only the names of the GRB in our Golden sample are indicated.
Current usage metrics show cumulative count of Article Views (full-text article views including HTML views, PDF and ePub downloads, according to the available data) and Abstracts Views on Vision4Press platform.
Data correspond to usage on the plateform after 2015. The current usage metrics is available 48-96 hours after online publication and is updated daily on week days.
Initial download of the metrics may take a while.