Fig. C.1.
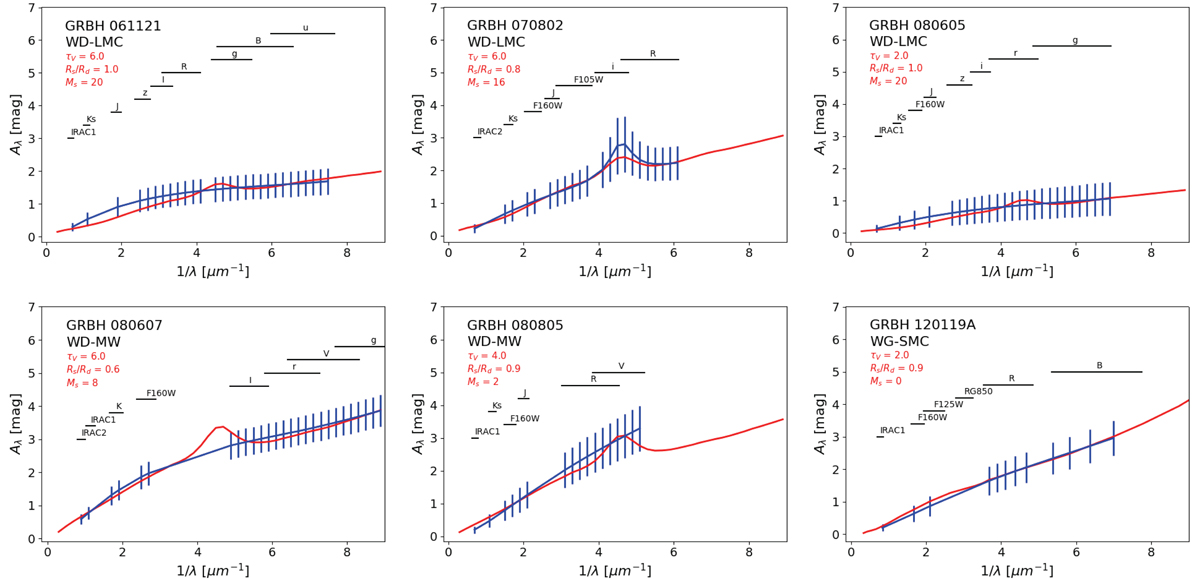
Best fits of the attenuation curve derived with CIGALE with the ones from radiative transfer simulations of Seon & Draine (2016). The blue errors bars correspond to the attenuation curve and associated uncertainty derived with CIGALE estimated at wavelengths used in the radiative transfer simulations and covered by observations. The red line corresponds to the attenuation curve from radiative transfer simulations which best fits the CIGALE attenuation curve. The black lines represent the spectral coverage of the host galaxy observations.
Current usage metrics show cumulative count of Article Views (full-text article views including HTML views, PDF and ePub downloads, according to the available data) and Abstracts Views on Vision4Press platform.
Data correspond to usage on the plateform after 2015. The current usage metrics is available 48-96 hours after online publication and is updated daily on week days.
Initial download of the metrics may take a while.