Fig. 15.
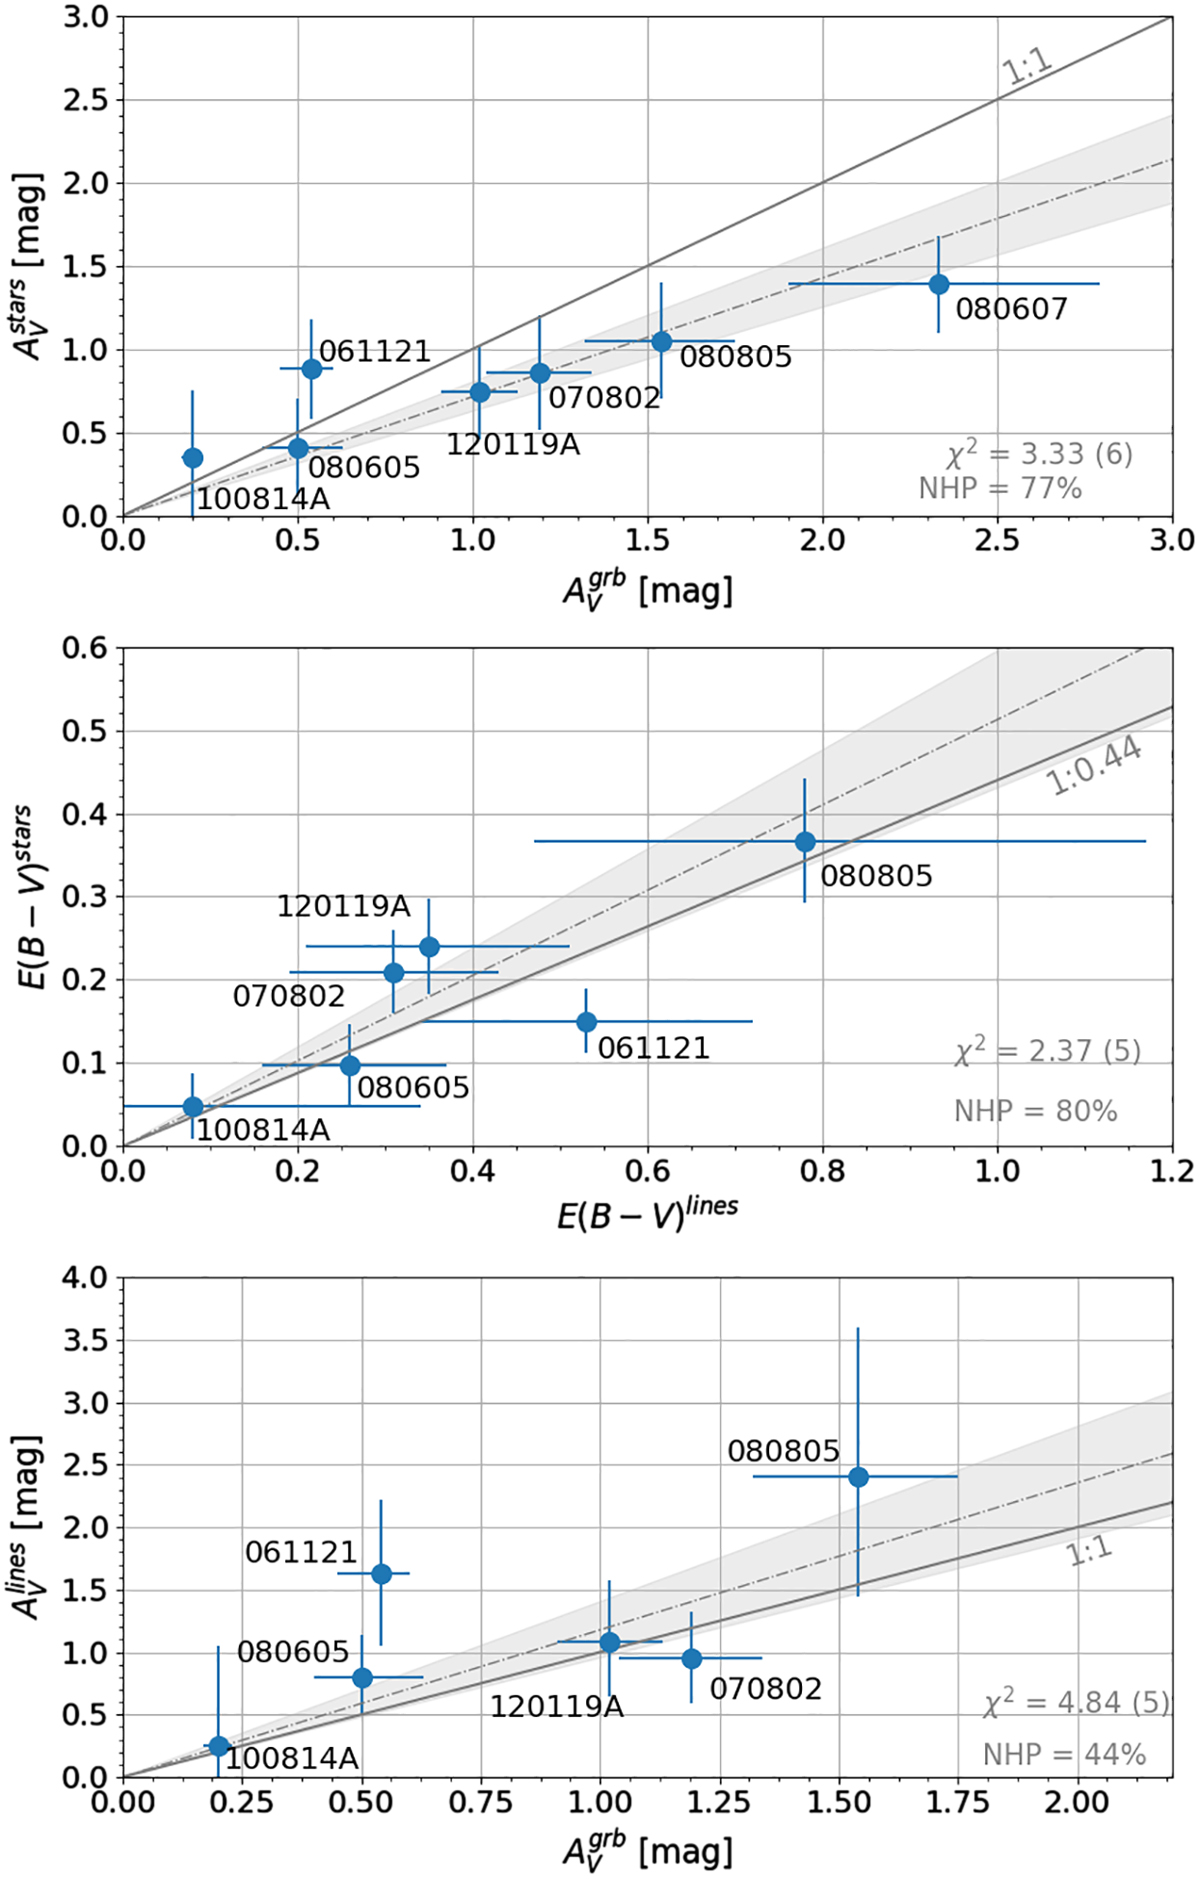
Top: amount of global attenuation in the GRBH in the V band as a function of the amount of extinction in the V band along the GRB l.o.s. Middle: colour excess for the stellar continuum as a function of the colour excess for the Balmer lines. The grey line represents the C00 relation. Bottom: amount of attenuation of the Balmer lines in the V band as a function as the amount of extinction in the V band along the GRB l.o.s. For all panels the grey dash-dotted line represents the best fit using an orthogonal distance regression (using SciPy’s scipy.odr) and the grey shaded area its 1σ uncertainty. The χ2, number of degrees of freedom and Null Hypothesis Probability (NHP) of these fist are indicated.
Current usage metrics show cumulative count of Article Views (full-text article views including HTML views, PDF and ePub downloads, according to the available data) and Abstracts Views on Vision4Press platform.
Data correspond to usage on the plateform after 2015. The current usage metrics is available 48-96 hours after online publication and is updated daily on week days.
Initial download of the metrics may take a while.