Fig. 14.
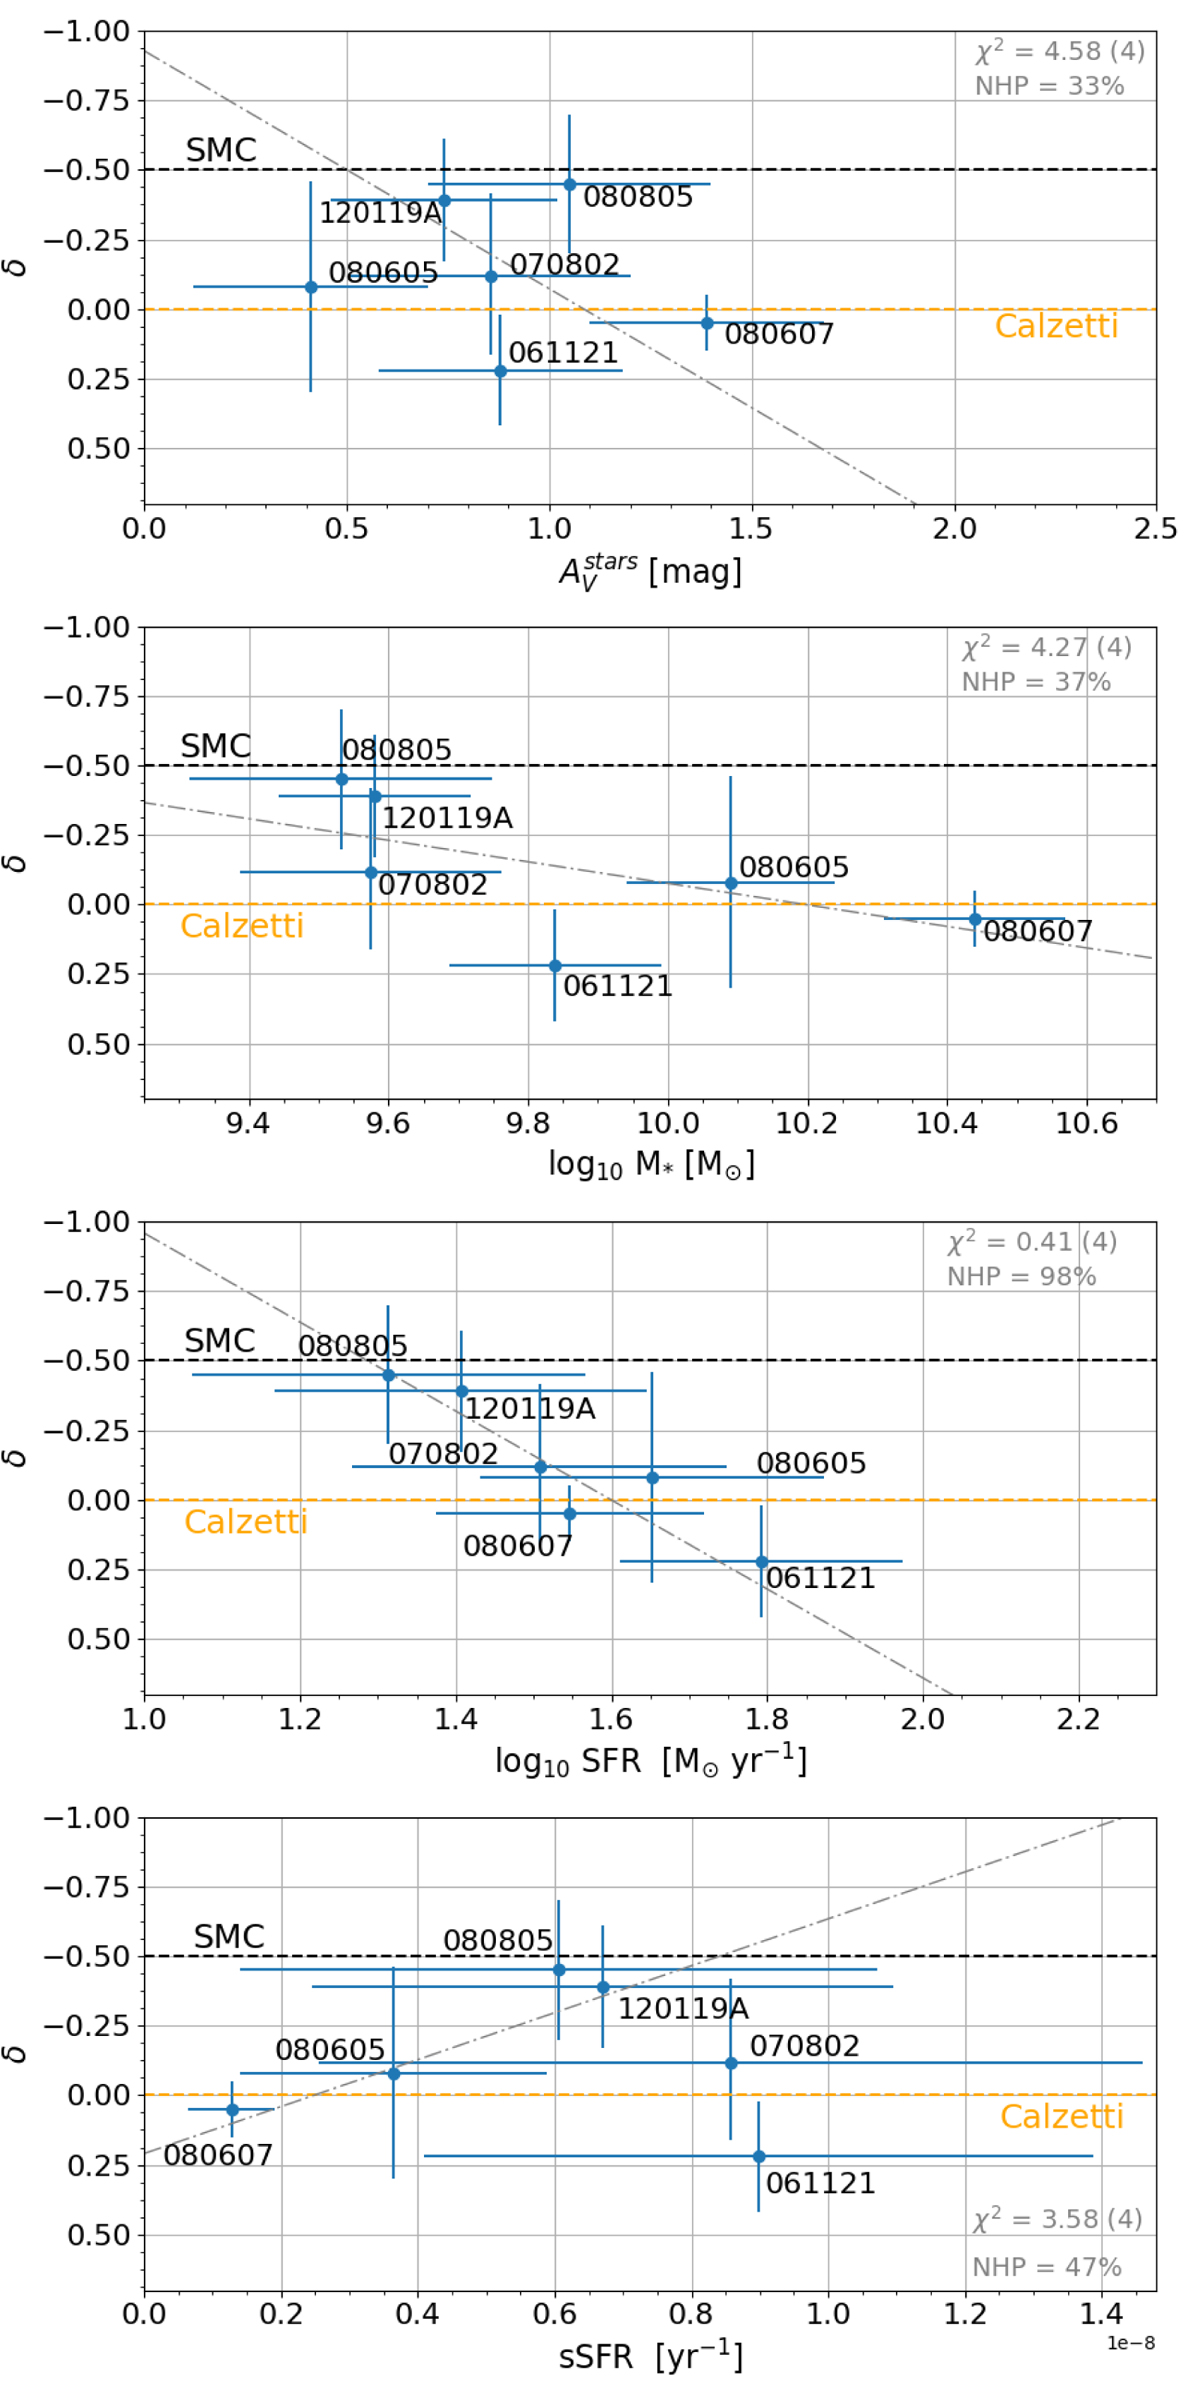
Top: attenuation curve slope as a function of the SED continuum amount of attenuation. Middle top: attenuation curve slope versus the stellar mass. Middle bottom: attenuation curve slope versus the SFR. Bottom: attenuation curve slope versus the specific SFR. The blue points correspond to the quantities derived with CIGALE. The black dashed line represents the slope of the mean SMC extinction curve and the yellow dashed line the slope of the Calzetti law. The grey dash-dotted line illustrates the best fit using an orthogonal distance regression (using SciPy’s scipy.odr). The χ2, number of degrees of freedom and Null Hypothesis Probability (NHP) of these fits are indicated.
Current usage metrics show cumulative count of Article Views (full-text article views including HTML views, PDF and ePub downloads, according to the available data) and Abstracts Views on Vision4Press platform.
Data correspond to usage on the plateform after 2015. The current usage metrics is available 48-96 hours after online publication and is updated daily on week days.
Initial download of the metrics may take a while.