Fig. 12.
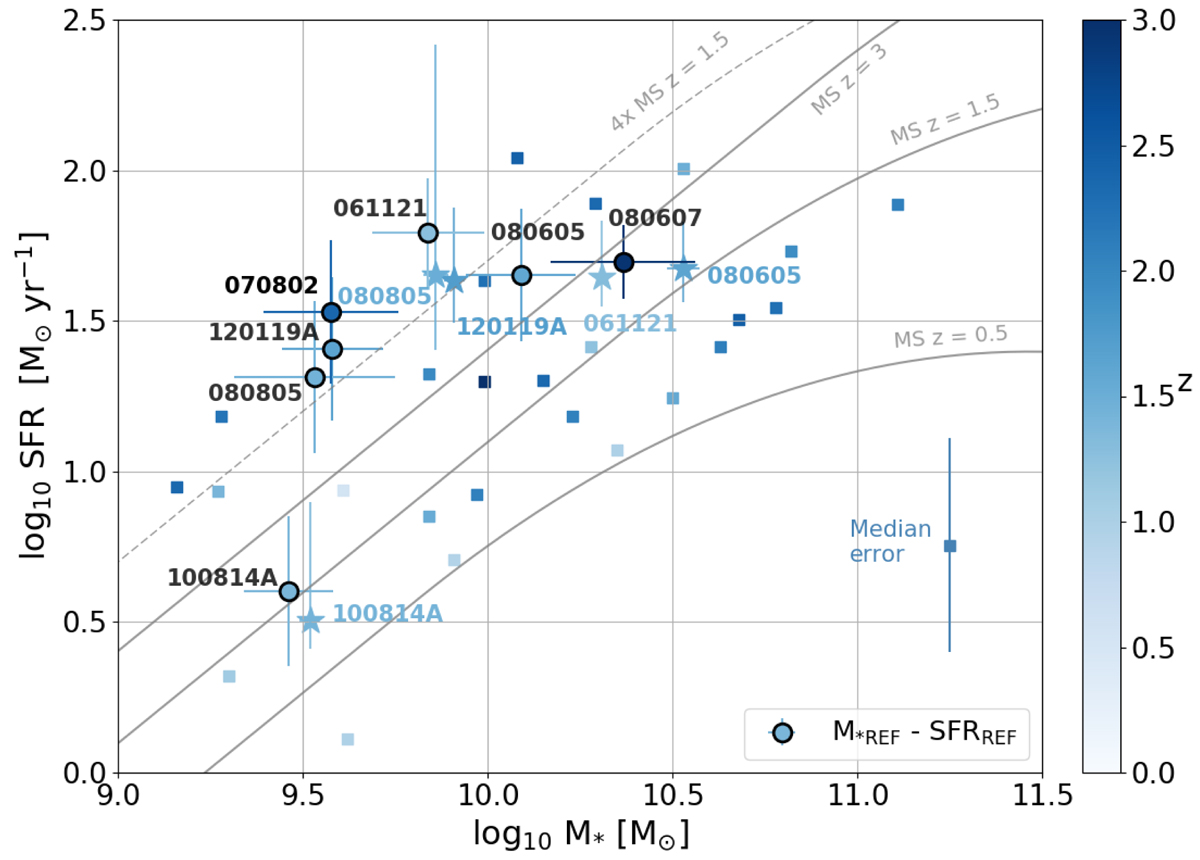
SFR-stellar mass relation. Blue points represent stellar masses from Perley et al. (2016) and SFR from Krühler et al. (2015) where we highlighted the GRBHs in our sample using a star symbol and the corresponding name. The colour map encodes the redshift. The black circles with blue interiors correspond to the GRBHs of our sample with SFR and stellar masses derived from the SED fitting. The grey lines represent the main sequence relation from Schreiber et al. (2015), the dashed line is four times the main sequence at z = 1.5 representative of starbursting galaxies (most of our our GRBHs are at z ∼ 1.5).
Current usage metrics show cumulative count of Article Views (full-text article views including HTML views, PDF and ePub downloads, according to the available data) and Abstracts Views on Vision4Press platform.
Data correspond to usage on the plateform after 2015. The current usage metrics is available 48-96 hours after online publication and is updated daily on week days.
Initial download of the metrics may take a while.