Free Access
Fig. 5.
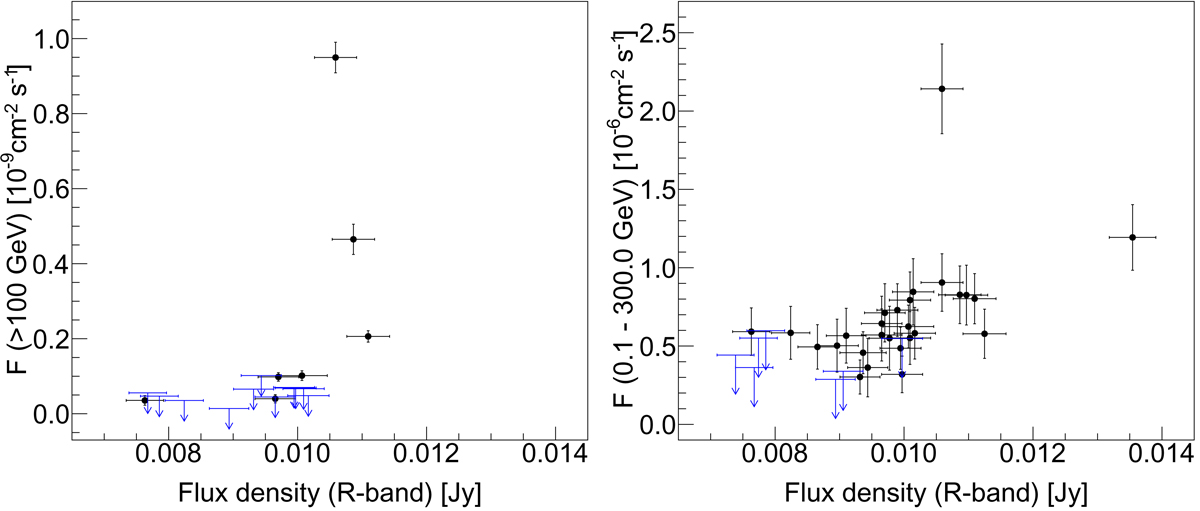
Gamma-ray flux versus optical flux density. Only measurements performed within less then half a day are included. Left panel: MAGIC flux above 100 GeV versus KVA R-band flux density. Right panel: Fermi-LAT flux between 0.1 GeV and 300 GeV versus KVA R-band flux density.
Current usage metrics show cumulative count of Article Views (full-text article views including HTML views, PDF and ePub downloads, according to the available data) and Abstracts Views on Vision4Press platform.
Data correspond to usage on the plateform after 2015. The current usage metrics is available 48-96 hours after online publication and is updated daily on week days.
Initial download of the metrics may take a while.