Fig. 4.
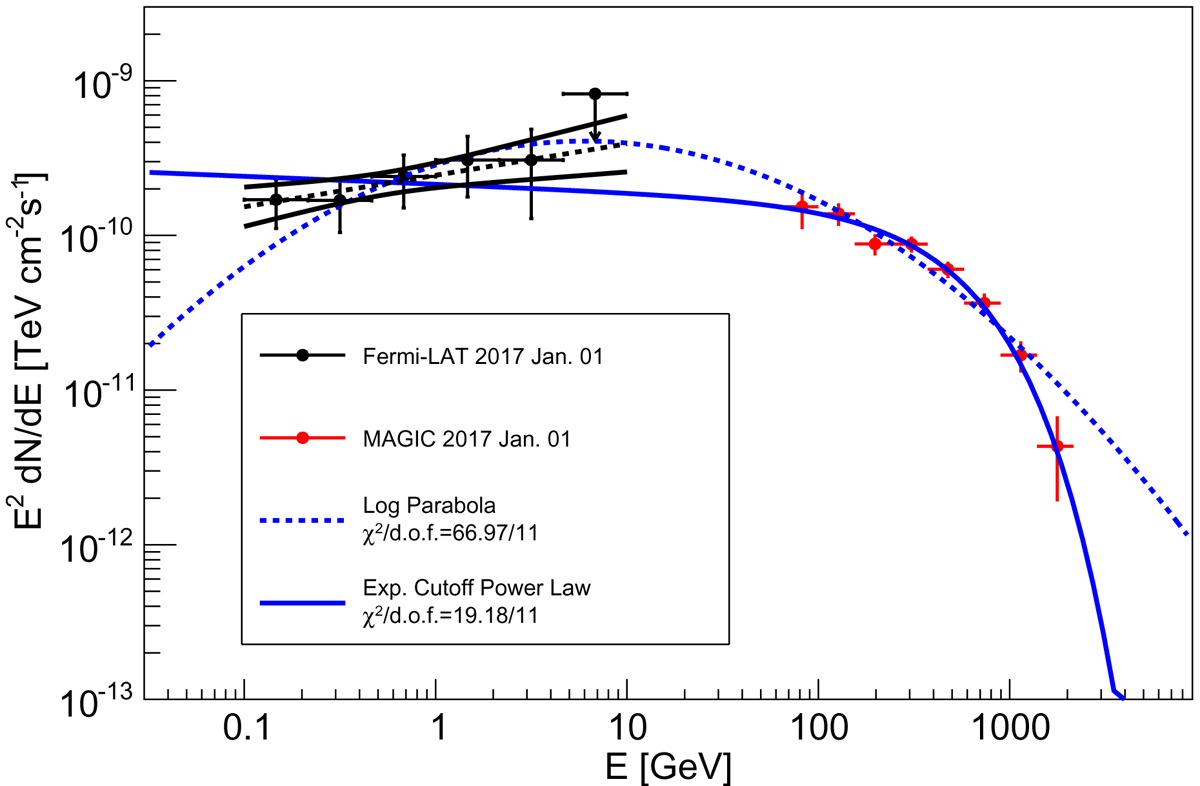
Combined spectral energy distribution from NGC 1275 measured with Fermi-LAT (low energy points and butterfly) and MAGIC (higher energy points) on 2017 January 1. The dashed and solid lines are fits to to the data points with a log-parabola and a power law with exponential cutoff function, respectively. The fit results are given in the legend. We note that for the fit VHE bins in estimated energy, here not represented, are used. Unfolded spectral points (in true energy bins) are plotted for comparison.
Current usage metrics show cumulative count of Article Views (full-text article views including HTML views, PDF and ePub downloads, according to the available data) and Abstracts Views on Vision4Press platform.
Data correspond to usage on the plateform after 2015. The current usage metrics is available 48-96 hours after online publication and is updated daily on week days.
Initial download of the metrics may take a while.