Fig. 3.
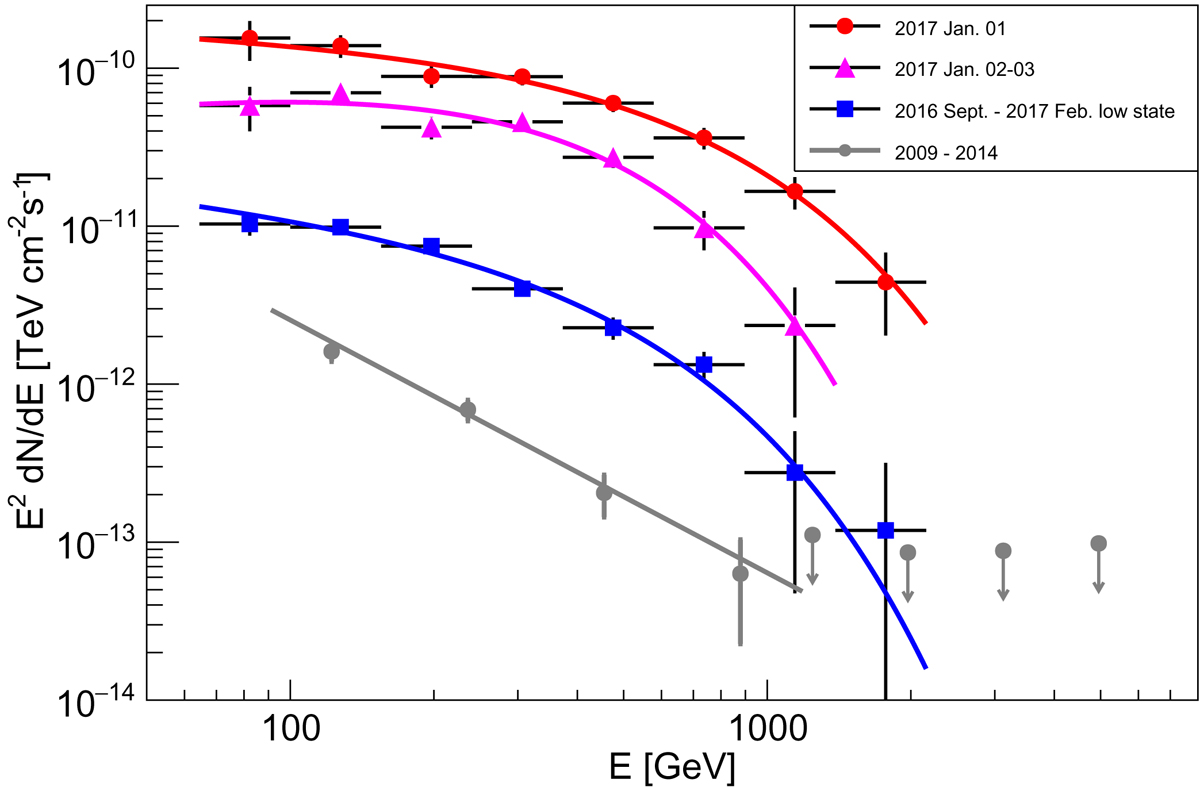
Measured spectral energy distributions in the VHE band during different periods. The red data points as well as the red line show the resulting SEDs from observations on 2017 January 1 while the purple points and purple line correspond to the measurement from 2017 January 2 to 2017 January 3. The SED calculated from the remaining observations between 2016 September and 2017 February is shown in blue. All results were obtained with power law with exponential cutoff fits. The averaged spectrum together with upper limit calculated with a photon index of Γ = 3.5 from observations in 2009 to 2014 is shown in grey (Ahnen et al. 2016).
Current usage metrics show cumulative count of Article Views (full-text article views including HTML views, PDF and ePub downloads, according to the available data) and Abstracts Views on Vision4Press platform.
Data correspond to usage on the plateform after 2015. The current usage metrics is available 48-96 hours after online publication and is updated daily on week days.
Initial download of the metrics may take a while.