Fig. 1.
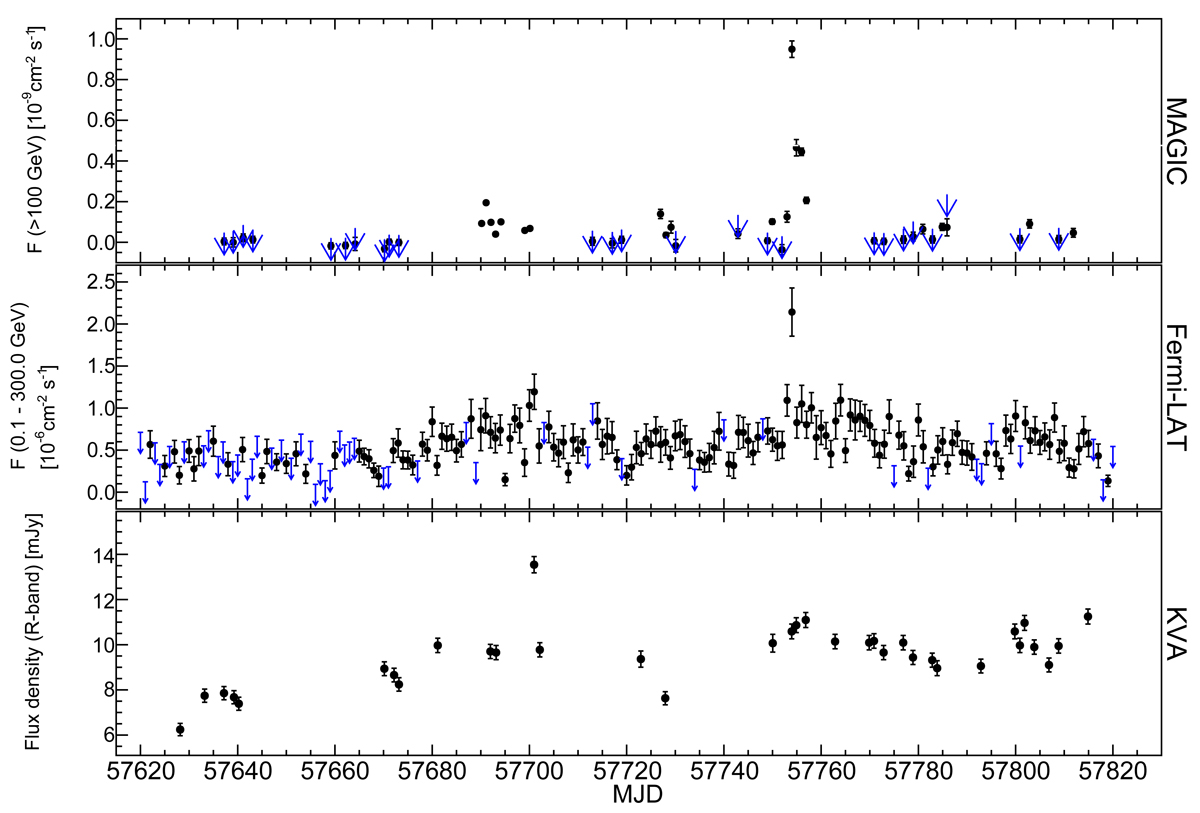
Light curves of NGC 1275 between 2016 September and 2017 February in different energy bands. Upper panel: daily (black data points and blue upper limits) flux measurements above 100 GeV obtained from MAGIC observations. All flux upper limits are given at 95% confidence level and were calculated assuming a total systematic uncertainty of 30% using the Rolke et al. (2005) method. Middle panel: daily binned fluxes (black data points) calculated from Fermi-LAT observations in an energy range of 0.1–300.0 GeV. Flux upper limits were estimated at 95% confidence level in the case of TS < 25 and are shown in blue. Bottom panel: R-band flux density measurements by KVA are host galaxy subtracted and corrected for galactic extinction.
Current usage metrics show cumulative count of Article Views (full-text article views including HTML views, PDF and ePub downloads, according to the available data) and Abstracts Views on Vision4Press platform.
Data correspond to usage on the plateform after 2015. The current usage metrics is available 48-96 hours after online publication and is updated daily on week days.
Initial download of the metrics may take a while.