Fig. 9.
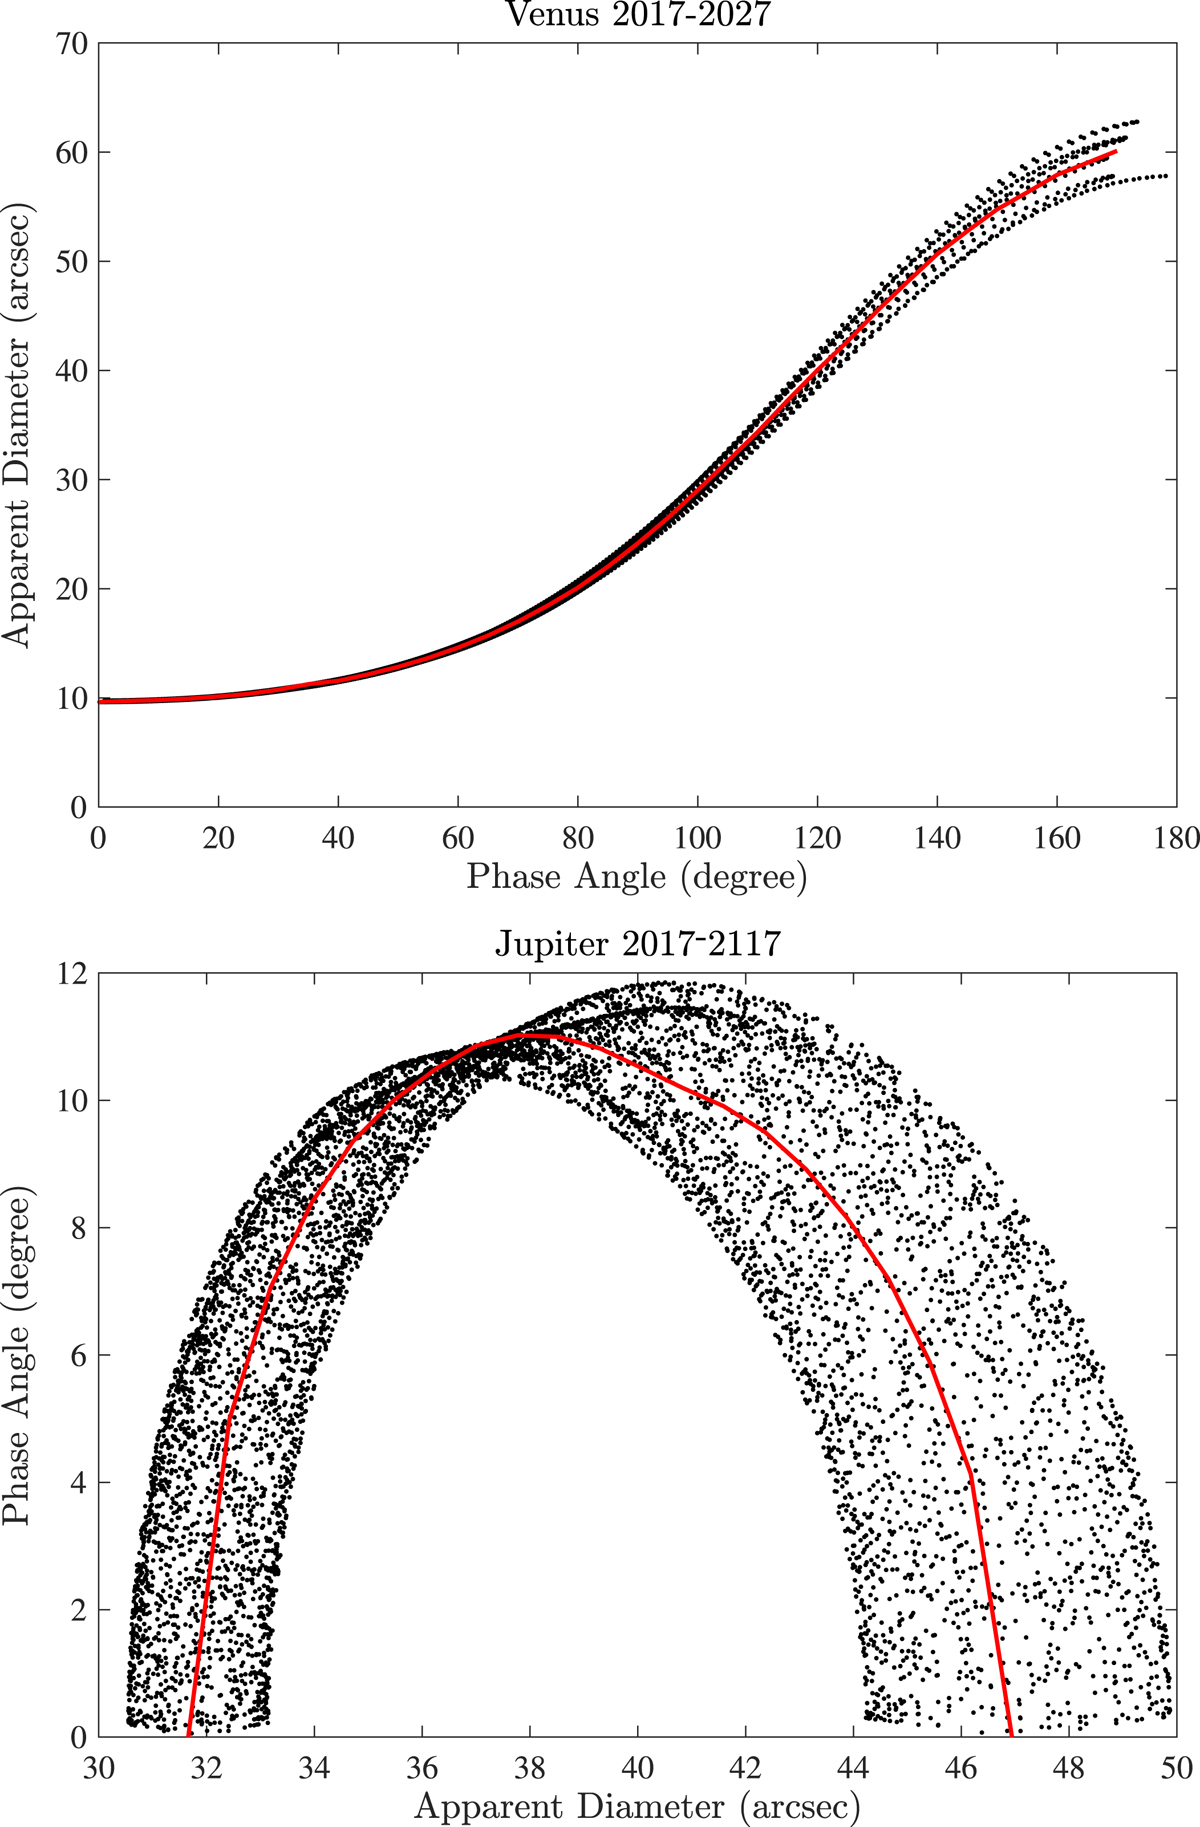
Top panel: apparent diameter of Venus (arcsec) as function of phase angle (degrees), from June 2017 to June 2027 (black dots). Bottom panel: same for Jupiter, with axis reversed with respect to Venus, and a longer time span (2017–2117) to average enough orbits. For both panels, the plain red curves indicate moving averages of the black dots, which were then used to associate an (two for Jupiter) angular diameter to a given phase angle in Fig. 10.
Current usage metrics show cumulative count of Article Views (full-text article views including HTML views, PDF and ePub downloads, according to the available data) and Abstracts Views on Vision4Press platform.
Data correspond to usage on the plateform after 2015. The current usage metrics is available 48-96 hours after online publication and is updated daily on week days.
Initial download of the metrics may take a while.