Fig. 14.
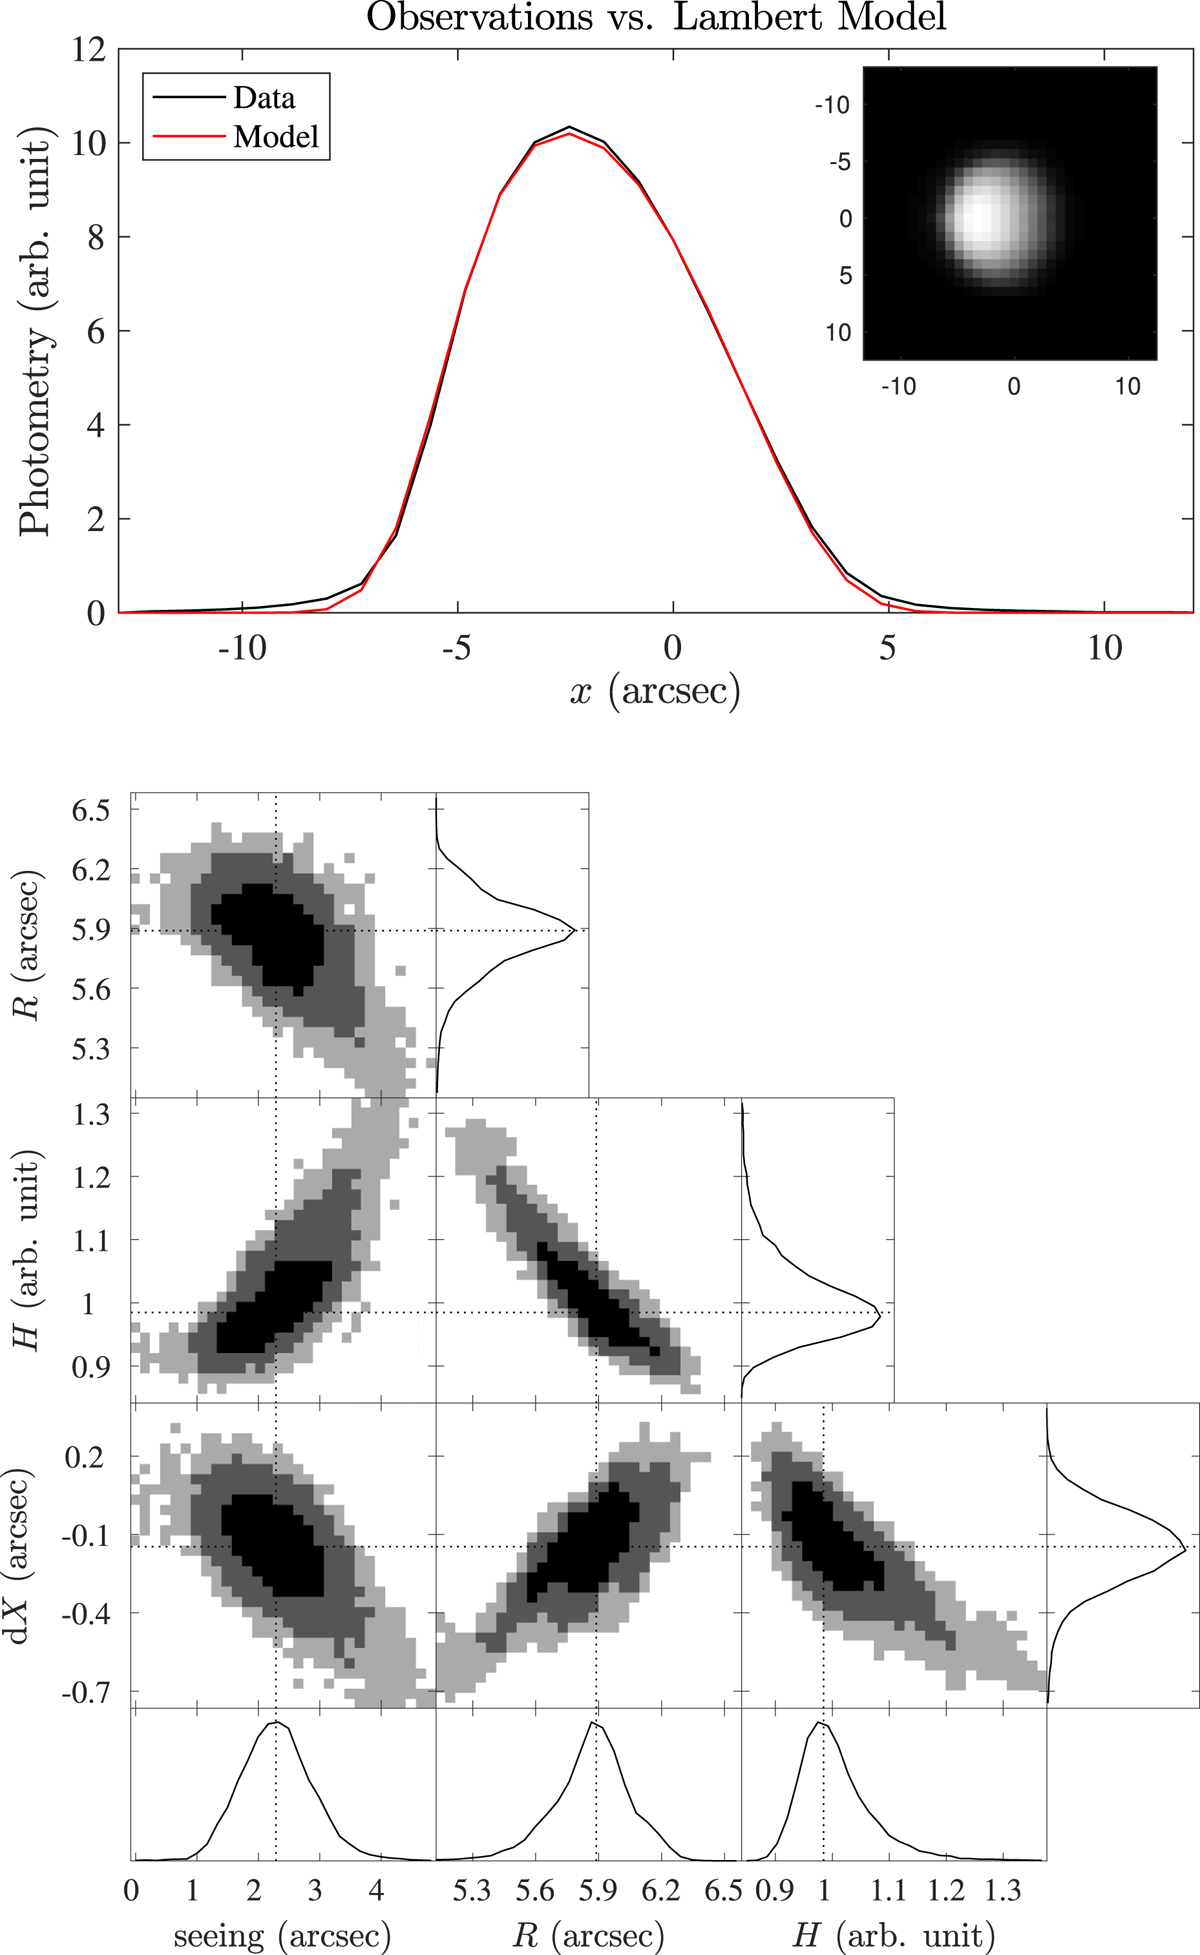
Modeling Venus photometric profile with a Lambert law. Top panel, subframe: image of Venus obtained with the THEMIS solar telescope (Gaulme et al. 2018). Top panel, main frame: the black line is the projection of the enclosed image along the x-axis, and the red line is the best-fit profile of it. Bottom panel: the above fitting was obtained by maximizing the likelihood of a Lambert-sphere model to the THEMIS observations, with an MCMC algorithm. Each subpanel represents the two-parameter joint posterior distributions of all free parameters. The 68.3, 95.5, and 99.7% confidence regions are denoted by three different gray levels. Probability density functions (PDFs) are plotted at the bottom and the right of the panels. The dotted lines mark the maximum probability value of the PDF of each parameter. After 200 000 iterations, the fitted values are: ![]() arcsec for the seeing,
arcsec for the seeing, ![]() arcsec for the apparent radius,
arcsec for the apparent radius, ![]() photometric amplitude (here normalized to the maximum value), and
photometric amplitude (here normalized to the maximum value), and ![]() arcsec for the planet’s decentering with respect to the center of the detector. The red curve on the upper panel is the result of the fitted values.
arcsec for the planet’s decentering with respect to the center of the detector. The red curve on the upper panel is the result of the fitted values.
Current usage metrics show cumulative count of Article Views (full-text article views including HTML views, PDF and ePub downloads, according to the available data) and Abstracts Views on Vision4Press platform.
Data correspond to usage on the plateform after 2015. The current usage metrics is available 48-96 hours after online publication and is updated daily on week days.
Initial download of the metrics may take a while.