Fig. 10.
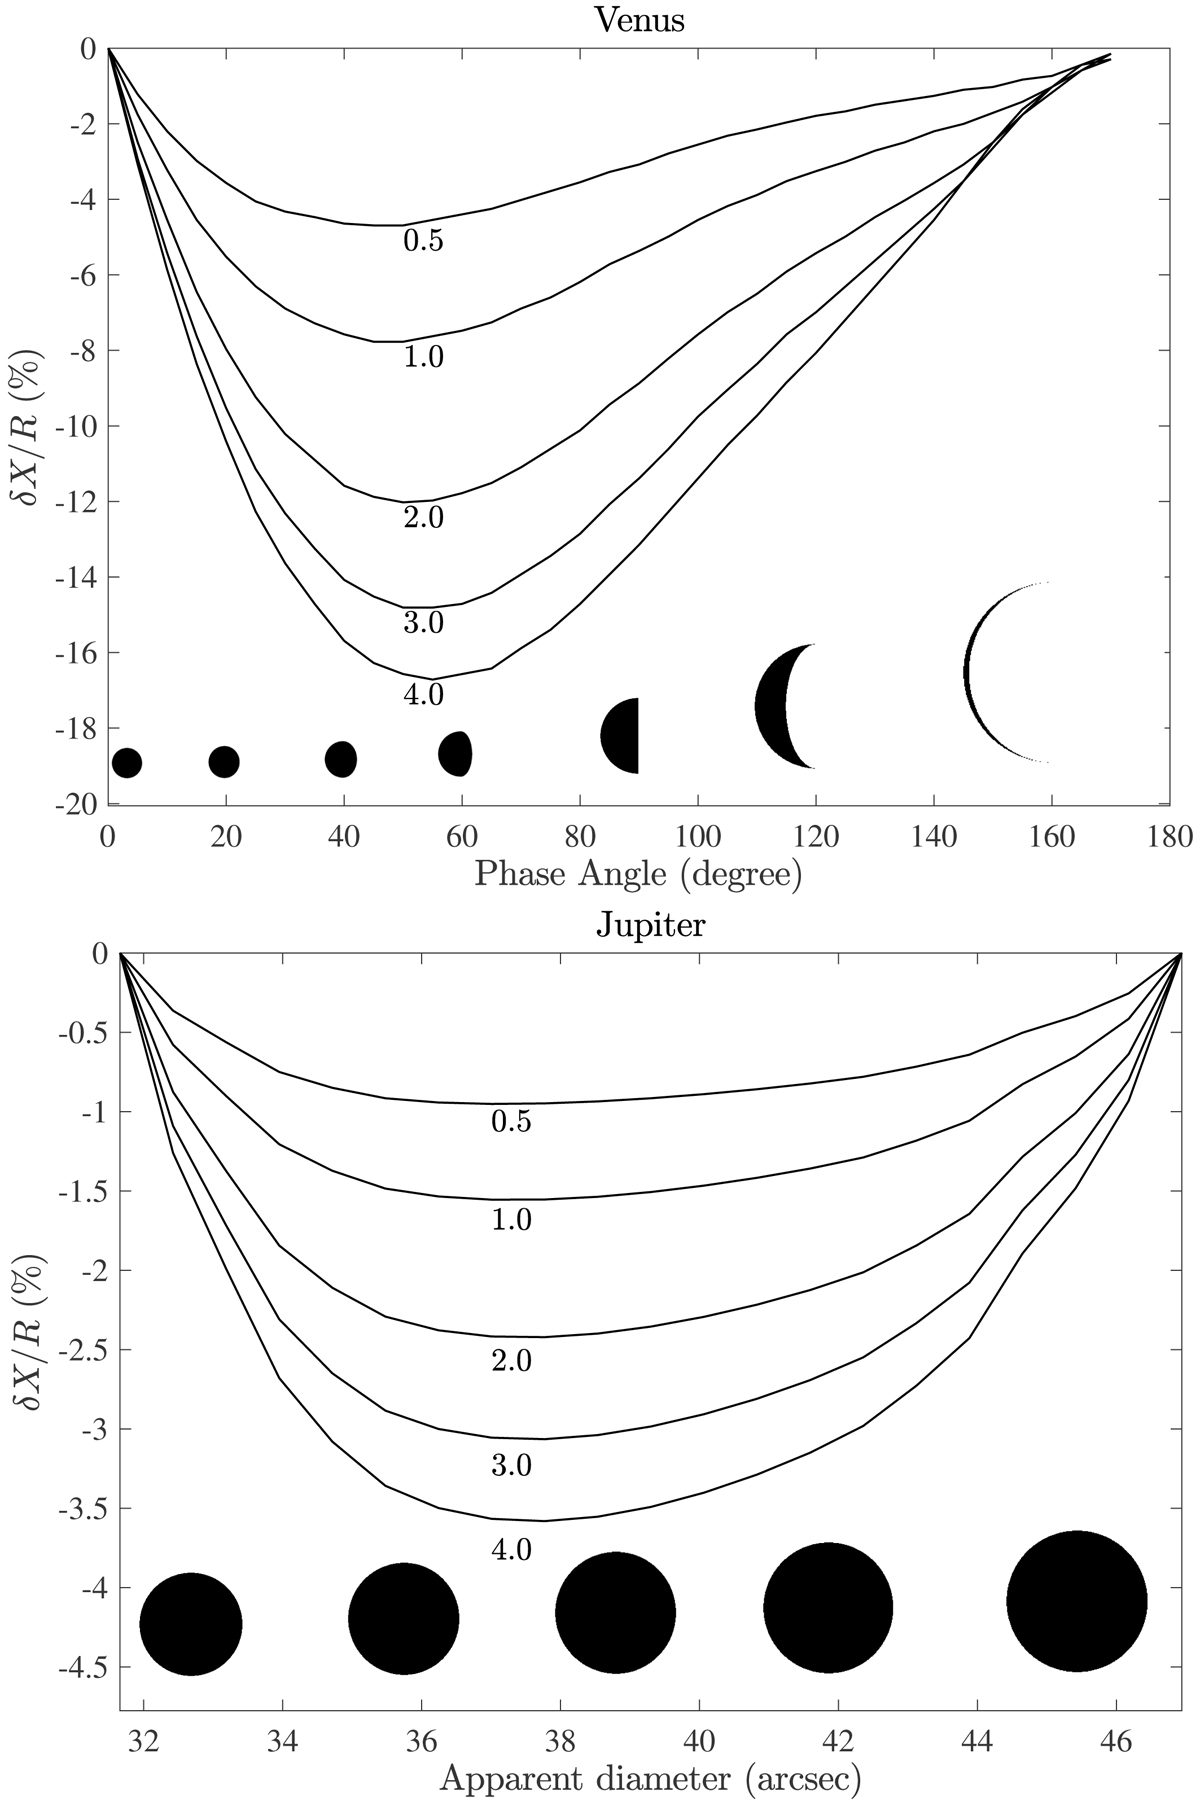
Apparent shift of a Lambert sphere in the conditions Venus (top) and Jupiter (bottom) are seen from Earth. In the case of Venus, the shift along the equator relatively to the planet’s radius δX/R is plotted as function of the phase angle (Sun–Venus–Earth). For Jupiter, δX/R is plotted as function of the apparent diameter. From top to bottom, the consecutive lines correspond to different seeing conditions, from 0.5 to 4 arcsec, as indicated near the minimum of each curve. The black shapes indicate the planet apparent sizes and phases. We note that proportions are conserved between the Venus and Jupiter panels.
Current usage metrics show cumulative count of Article Views (full-text article views including HTML views, PDF and ePub downloads, according to the available data) and Abstracts Views on Vision4Press platform.
Data correspond to usage on the plateform after 2015. The current usage metrics is available 48-96 hours after online publication and is updated daily on week days.
Initial download of the metrics may take a while.