Fig. 9.
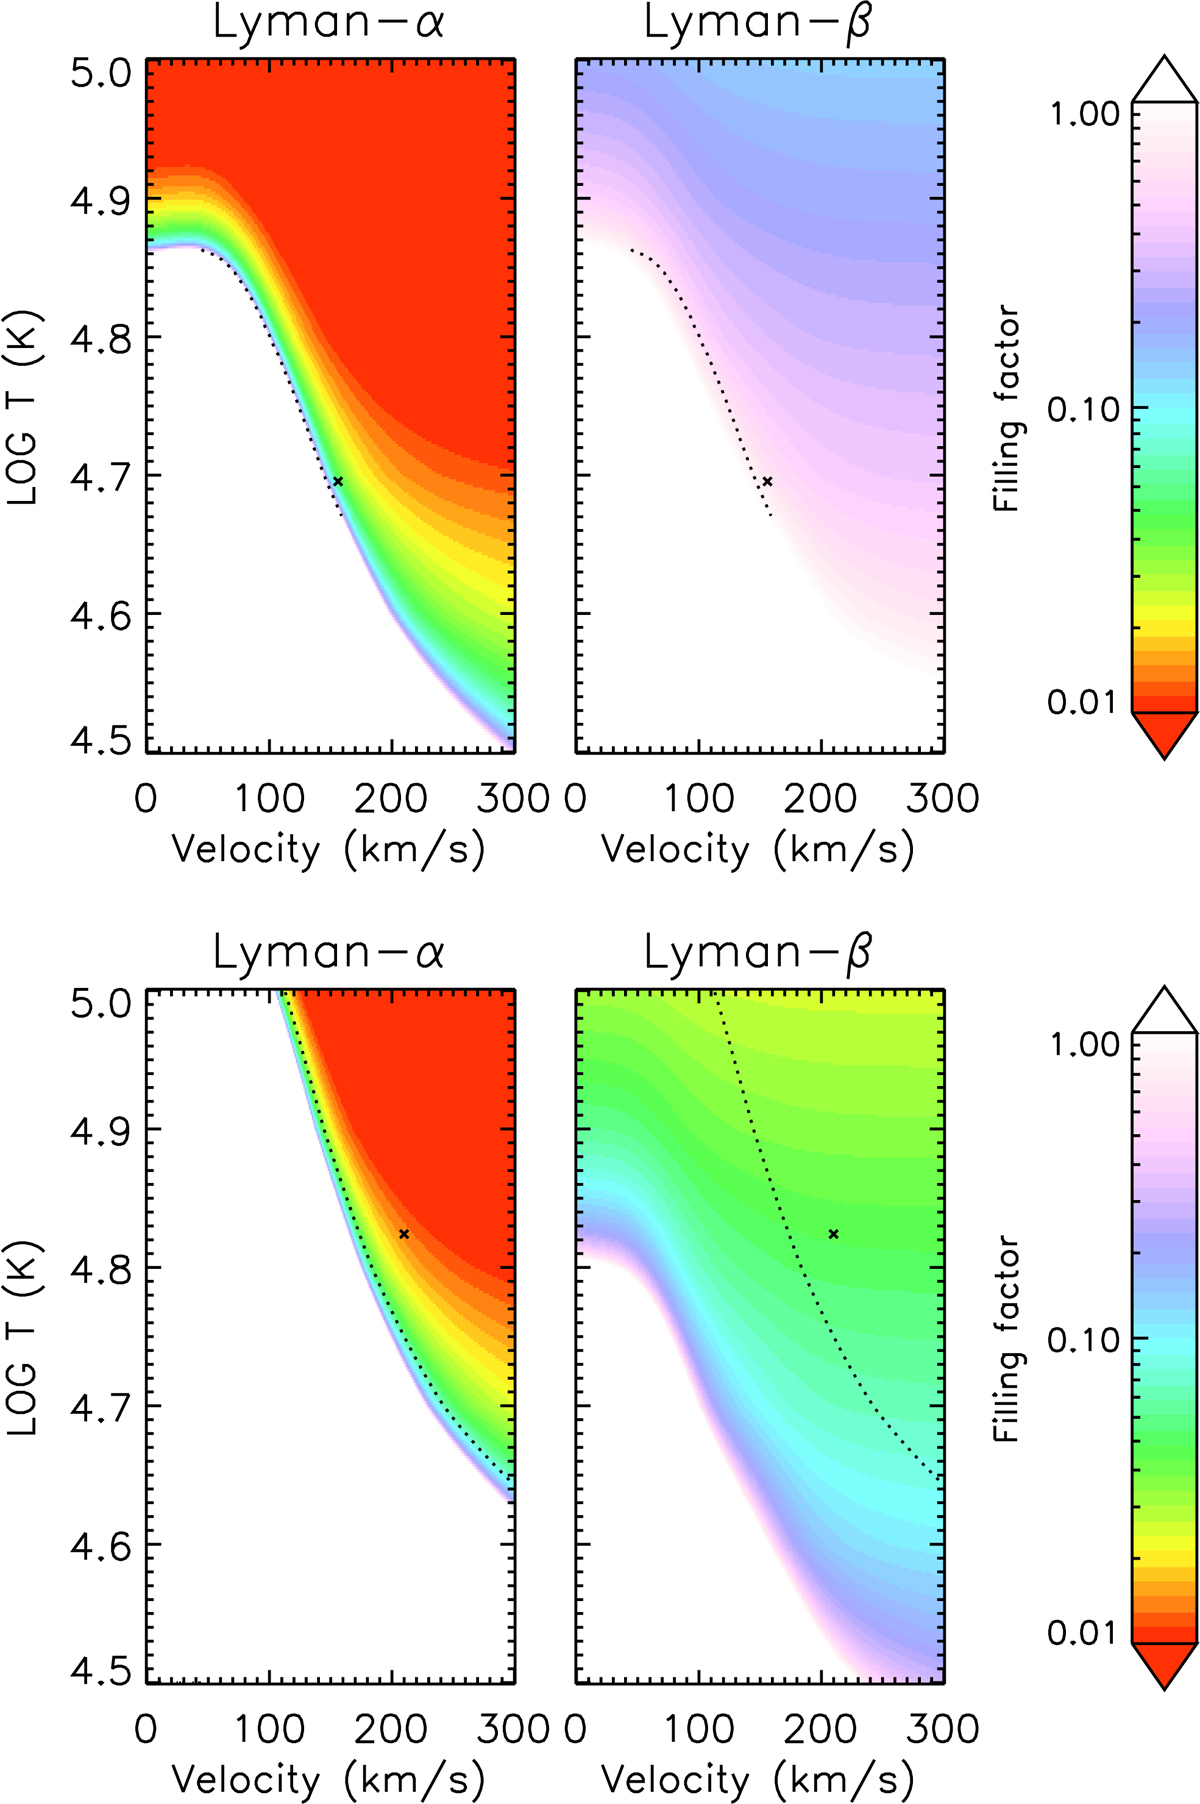
Filling factor maps obtained with combination of Eqs. (6) and (8) as a function of outflow velocity and kinetic temperature. For each pair (v, T), the maps give the corresponding f values required to reproduce the intensities of the Lyα (left panels) and Lyα (right panels) lines measured in point P1 (top panels) and P2 (bottom panels), respectively. The dotted line identifies the region of the parameter space (projected onto the [v, T] plane) where intensities of both lines are matched simultaneously. As in Fig. 8, the crosses mark the points corresponding to the non-LTE-model results.
Current usage metrics show cumulative count of Article Views (full-text article views including HTML views, PDF and ePub downloads, according to the available data) and Abstracts Views on Vision4Press platform.
Data correspond to usage on the plateform after 2015. The current usage metrics is available 48-96 hours after online publication and is updated daily on week days.
Initial download of the metrics may take a while.