Free Access
Fig. 8.
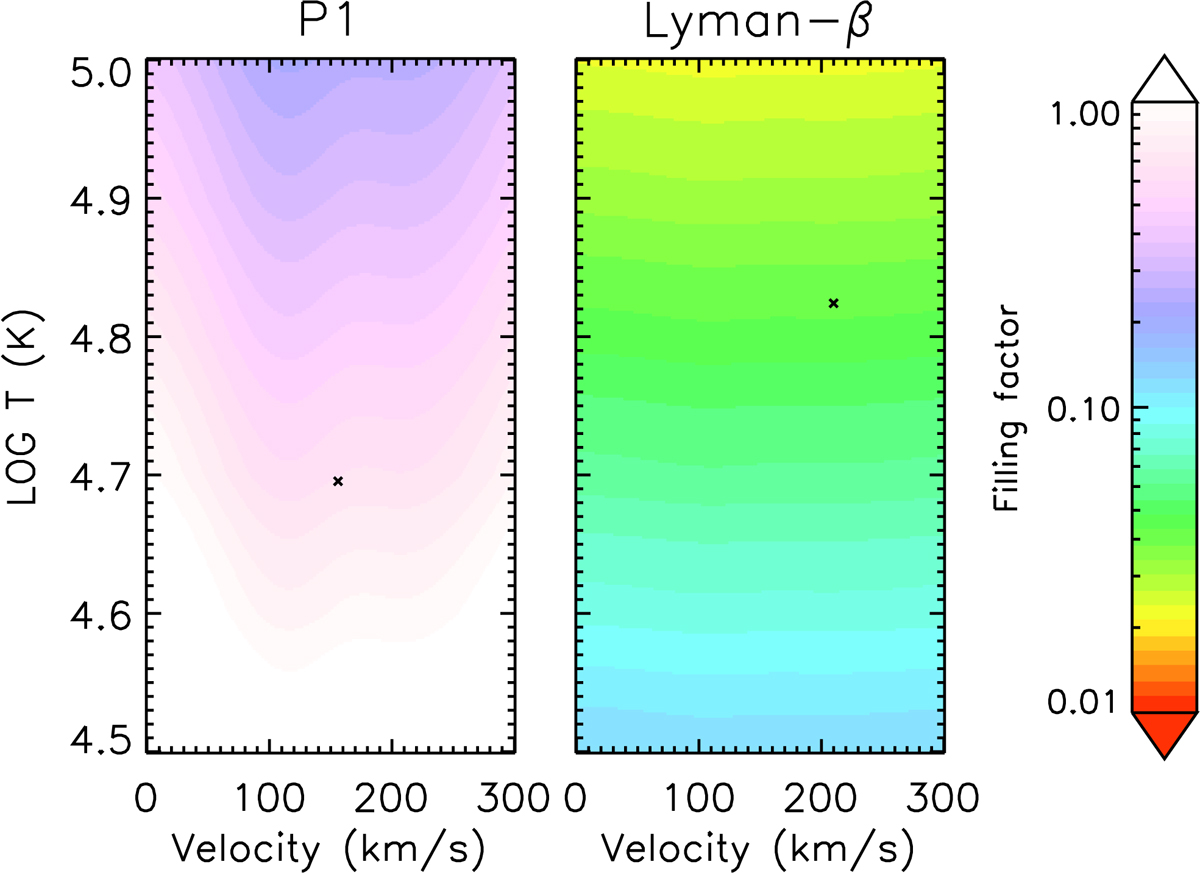
2D maps of the filling factor obtained using Eq. (15) as a function of outflow velocity and kinetic temperature for point P1 (left panel) and P2 (right panel). The crosses mark the points in the (v, T) plane corresponding to the non-LTE-model results.
Current usage metrics show cumulative count of Article Views (full-text article views including HTML views, PDF and ePub downloads, according to the available data) and Abstracts Views on Vision4Press platform.
Data correspond to usage on the plateform after 2015. The current usage metrics is available 48-96 hours after online publication and is updated daily on week days.
Initial download of the metrics may take a while.