Fig. 6.
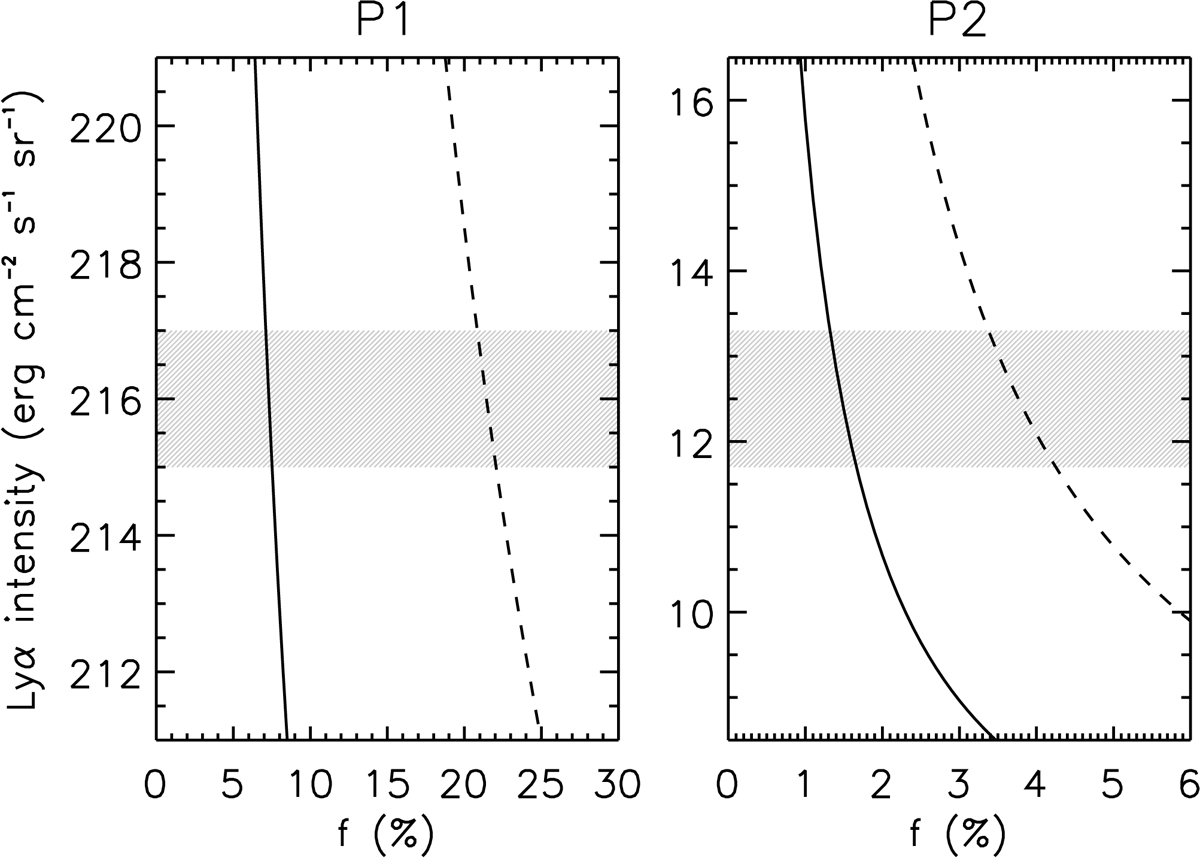
Total Lyα intensity computed as a function of the LOS plasma filling factor using the method described in Sect. 5.2 with the numerical (solid lines) and theoretical (using Eq. (12); dashed line) collisional coefficients for the computation of the collisional rates. The gray bands, plotted for reference purposes, mark the uncertainty range around the total integrated line intensities measured with UVCS.
Current usage metrics show cumulative count of Article Views (full-text article views including HTML views, PDF and ePub downloads, according to the available data) and Abstracts Views on Vision4Press platform.
Data correspond to usage on the plateform after 2015. The current usage metrics is available 48-96 hours after online publication and is updated daily on week days.
Initial download of the metrics may take a while.