Fig. 7.
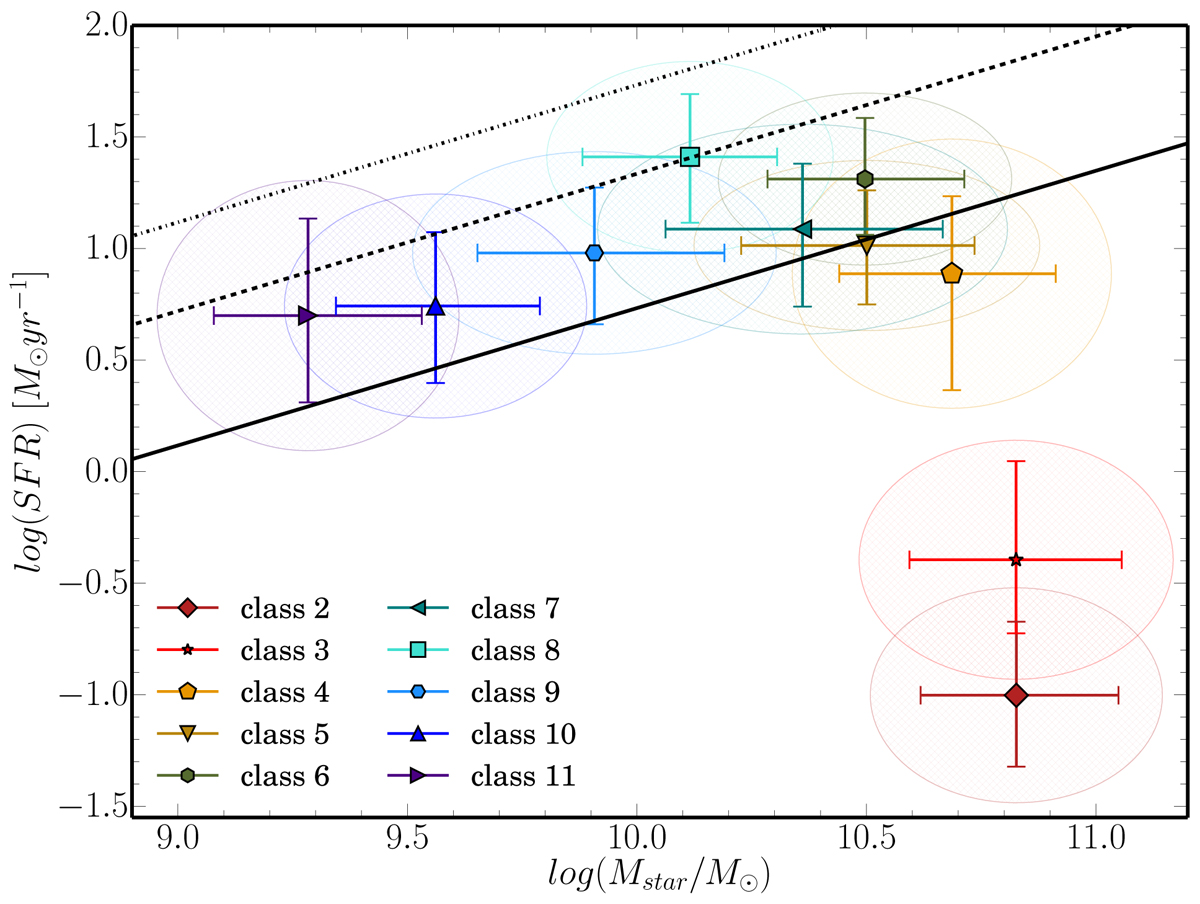
SFR-stellar mass relation for FEM classification. The median log(SFR) vs. median log(Mstar/M⊙) for classes 2–11 are shown. The error bars correspond to the first and third quartile of the galaxy SFR-stellar mass distribution, while the area of ellipses correspond to the median absolute deviations. The colours are given as in Fig. 2. The first class is not plotted due to its very low median SFR. The black solid line corresponds to the MS trend at z = 0.7 found by Whitaker et al. (2012), while dashed and dashed-dotted lines correspond to 4 × MS, and 10 × MS to represent active star-forming and starburst galaxies, respectively, following Rodighiero et al. (2011).
Current usage metrics show cumulative count of Article Views (full-text article views including HTML views, PDF and ePub downloads, according to the available data) and Abstracts Views on Vision4Press platform.
Data correspond to usage on the plateform after 2015. The current usage metrics is available 48-96 hours after online publication and is updated daily on week days.
Initial download of the metrics may take a while.