Fig. 3.
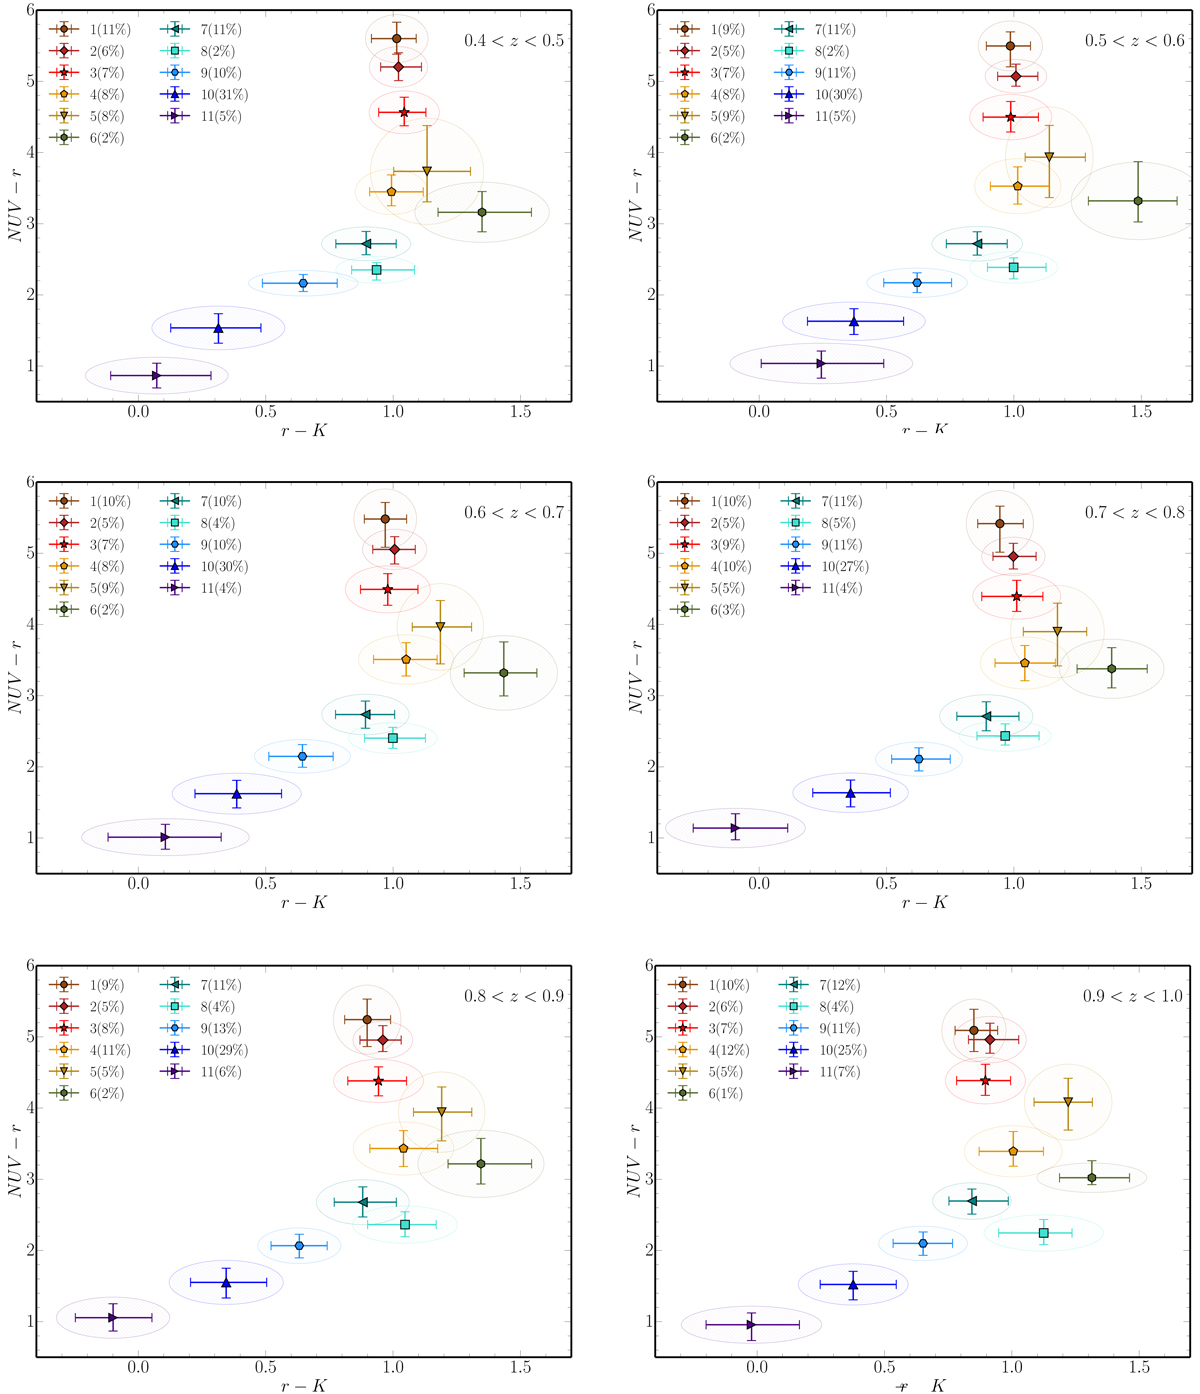
NUVrK diagrams of the 11 FEM classes in six different redshift bins spanning the redshift range 0.4 < z < 1.0. The error bars correspond to the first and the third quartiles of the galaxy colour distribution, while the two axes of the ellipses correspond to the median absolute deviations. The fraction of galaxies in each class is given in the legend.
Current usage metrics show cumulative count of Article Views (full-text article views including HTML views, PDF and ePub downloads, according to the available data) and Abstracts Views on Vision4Press platform.
Data correspond to usage on the plateform after 2015. The current usage metrics is available 48-96 hours after online publication and is updated daily on week days.
Initial download of the metrics may take a while.