Fig. B.1.
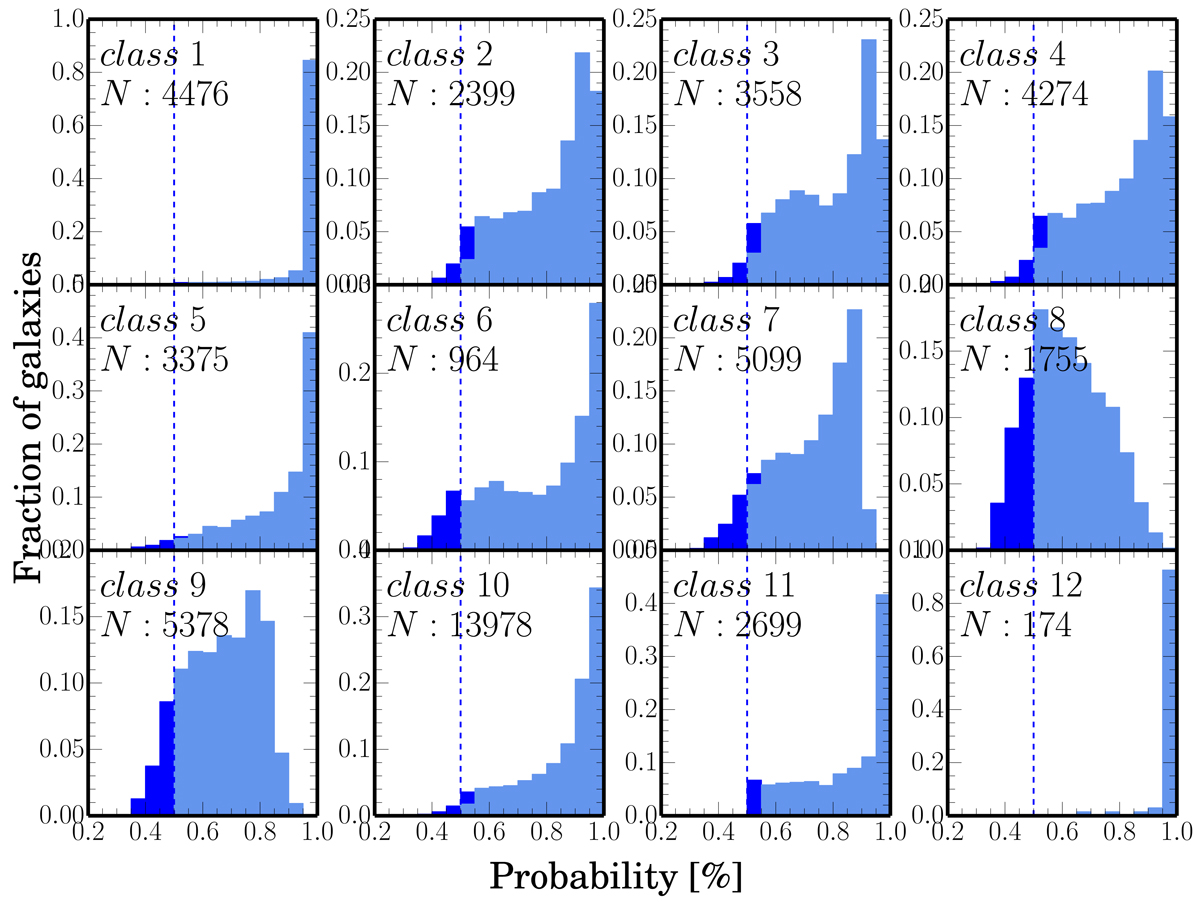
Distribution of the class membership probabilities for all sources (dark blue), and for the final sample of galaxies (with first-best probability > 50% and second-best < 45%; in light blue) for each FEM class. The threshold (50%) used to remove outliers in the subsequent analysis is marked with a blue dashed line. The final number of class members is given in each panel.
Current usage metrics show cumulative count of Article Views (full-text article views including HTML views, PDF and ePub downloads, according to the available data) and Abstracts Views on Vision4Press platform.
Data correspond to usage on the plateform after 2015. The current usage metrics is available 48-96 hours after online publication and is updated daily on week days.
Initial download of the metrics may take a while.