Fig. 10.
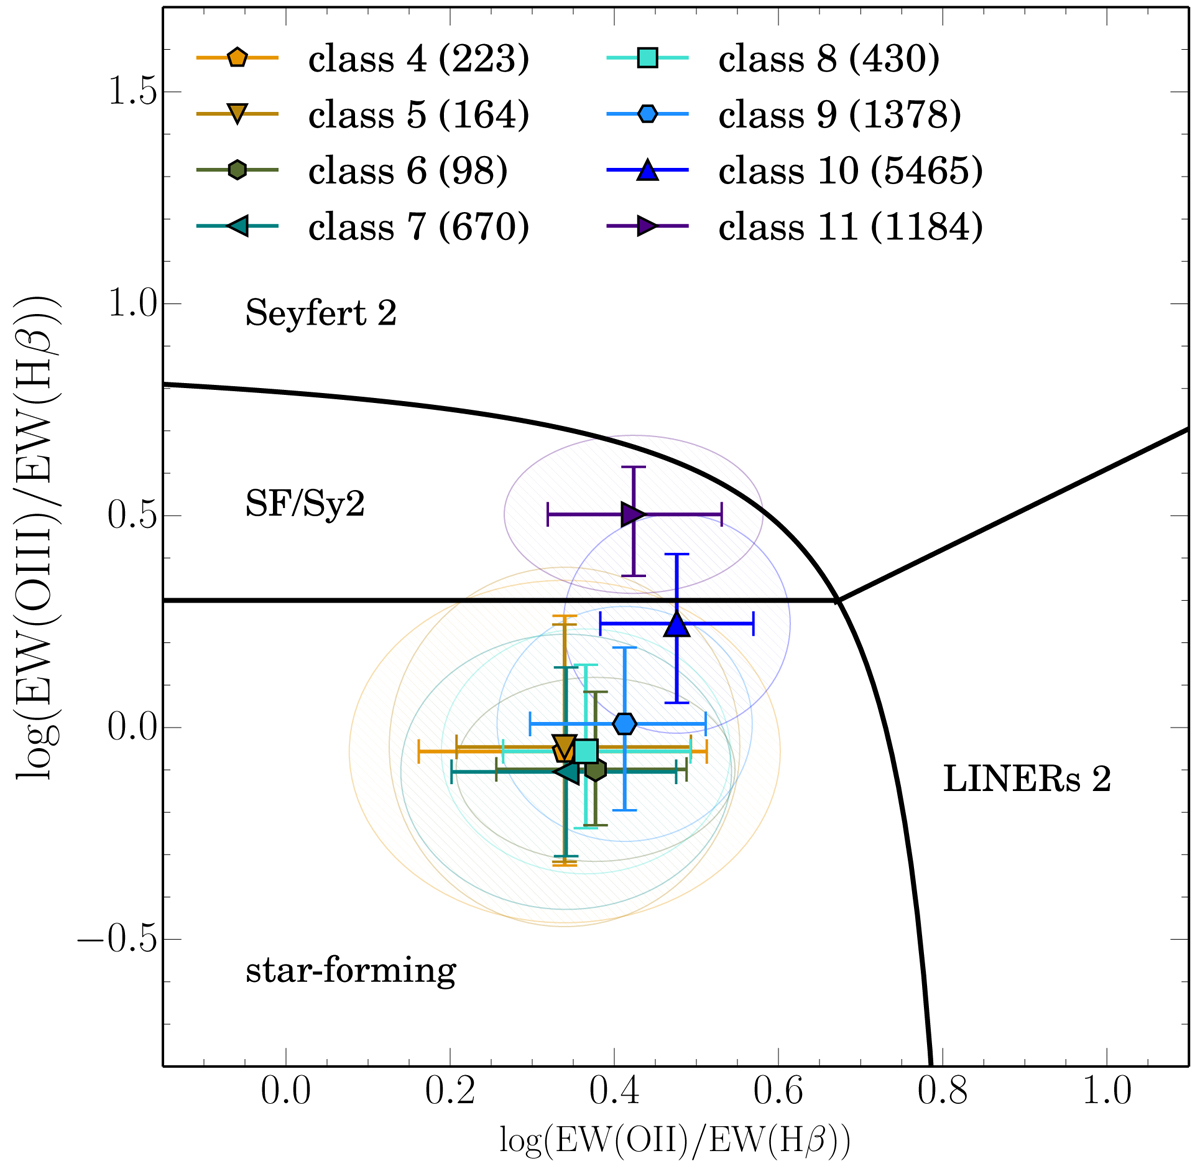
The distributions of FEM classes 4–11 on the “blue” BPT diagram introduced by Lamareille (2010). The number of spectra in each class for which lines were measured in the redshift range 0.4 < z < 1.3 are given in the legend. The error bars correspond to the first and third quartile of the line measurements distribution, while the area of ellipses correspond to the median absolute deviations.
Current usage metrics show cumulative count of Article Views (full-text article views including HTML views, PDF and ePub downloads, according to the available data) and Abstracts Views on Vision4Press platform.
Data correspond to usage on the plateform after 2015. The current usage metrics is available 48-96 hours after online publication and is updated daily on week days.
Initial download of the metrics may take a while.