Fig. 5.
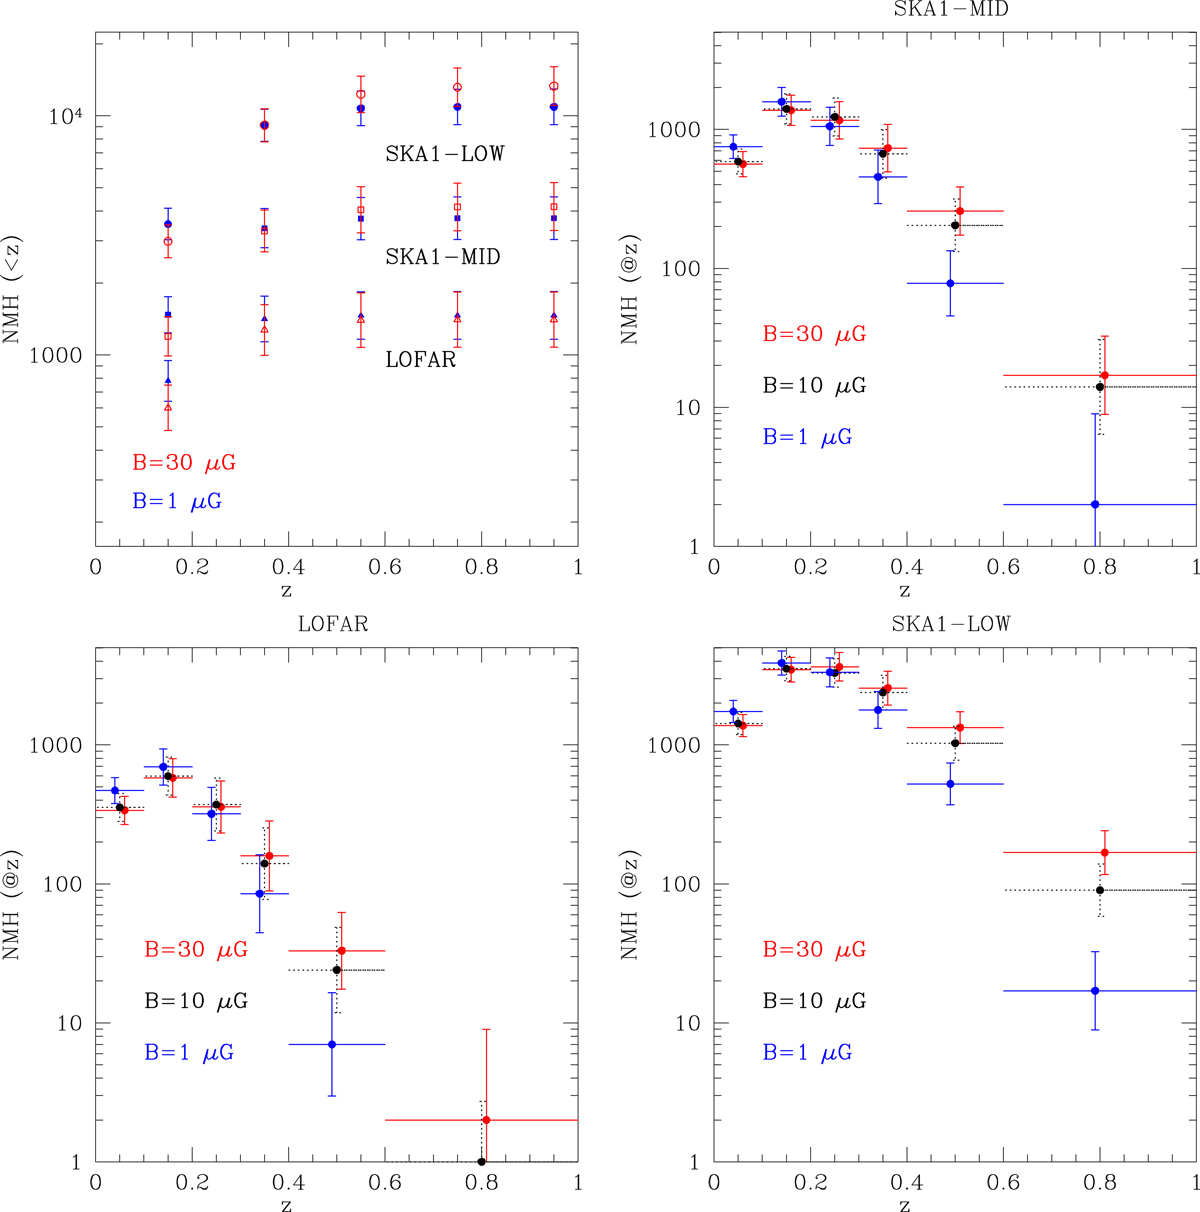
Top left panel: integral number of radio mini-halo candidates (3π sr) observable at 140 MHz by LOFAR (triangles) and SKA1-LOW (circles), and at 1.4 GHz by SKA1-MID (squares) as a function of redshift, estimated by assuming two reference values of B = 1 μG (blue) and B = 30 μG (red). The error bars indicate the 1σ uncertainty driven by the Pradio − LX correlation (Eq. (4)). Top right panel: differential number of radio mini-halo candidates (3π sr) observable at 1.4 GHz by SKA1-MID in different redshift bins, estimated by assuming three reference values of B = 1 μG (blue), B = 10 μG (black), and B = 30 μG (red). The vertical error bars indicate the 1σ uncertainty driven by the Pradio − LX correlation (Eq. (4)), and the horizontal bars indicate the size of the redshift bin. The points corresponding to the three different B-field values in the same redshift bin are slightly shifted on the x-axis to improve clarity. Bottom left panel: same as top right panel, but showing the results for LOFAR at 140 MHz. Bottom right panel: same as top right panel, but showing the results for SKA1-LOW at 140 MHz.
Current usage metrics show cumulative count of Article Views (full-text article views including HTML views, PDF and ePub downloads, according to the available data) and Abstracts Views on Vision4Press platform.
Data correspond to usage on the plateform after 2015. The current usage metrics is available 48-96 hours after online publication and is updated daily on week days.
Initial download of the metrics may take a while.