Fig. 4.
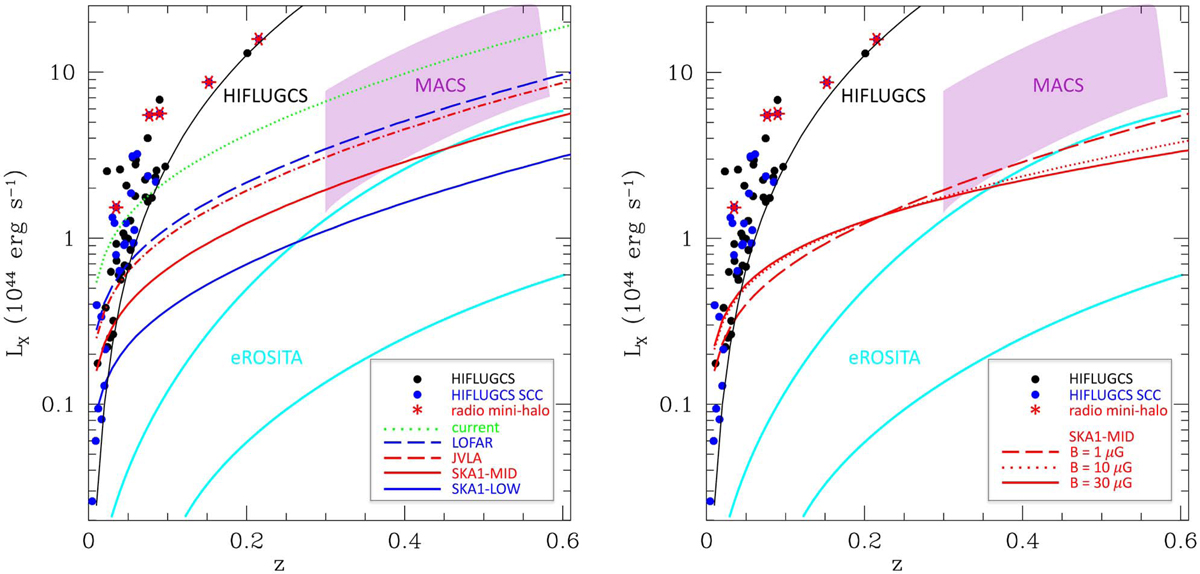
Left panel: X-ray luminosity in the 0.5–2.0 keV band versus redshift for the clusters in the HIFLUGCS sample (Reiprich & Böhringer 2002). The flux limit is shown as a black solid line. The blue filled circles represent the clusters classified as SCC (Hudson et al. 2010), and the clusters known to host radio mini-halos are highlighted with red stars. For comparison, we also draw the LX − z distribution of clusters from other X-ray selected samples: the shaded magenta region indicates the position of MACS clusters (Ebeling et al. 2010), and the cyan solid lines show the eROSITA threshold luminosity predicted with 500 (upper line) and 50 (lower line) photon counts (Pillepich et al. 2012). Our results on the detection limits reachable by radio follow-up are estimated with the performances adopted in Table 1 (see Sect. 3.1) and a typical magnetic field of B = 1 μG: from existing observations (green dotted line), from 1.4 GHz JVLA pointed observations and SKA1-MID surveys (red dashed and solid lines, respectively), and from 140 MHz LOFAR and SKA1-LOW surveys (blue dashed and solid lines, respectively). Right panel: same as left panel, but showing only the detection limits reachable by radio follow-up with SKA1-MID assuming three different magnetic fields: B = 1 μG (dashed line), B = 10 μG (dotted line), and B = 30 μG (solid line).
Current usage metrics show cumulative count of Article Views (full-text article views including HTML views, PDF and ePub downloads, according to the available data) and Abstracts Views on Vision4Press platform.
Data correspond to usage on the plateform after 2015. The current usage metrics is available 48-96 hours after online publication and is updated daily on week days.
Initial download of the metrics may take a while.