Fig. 2.
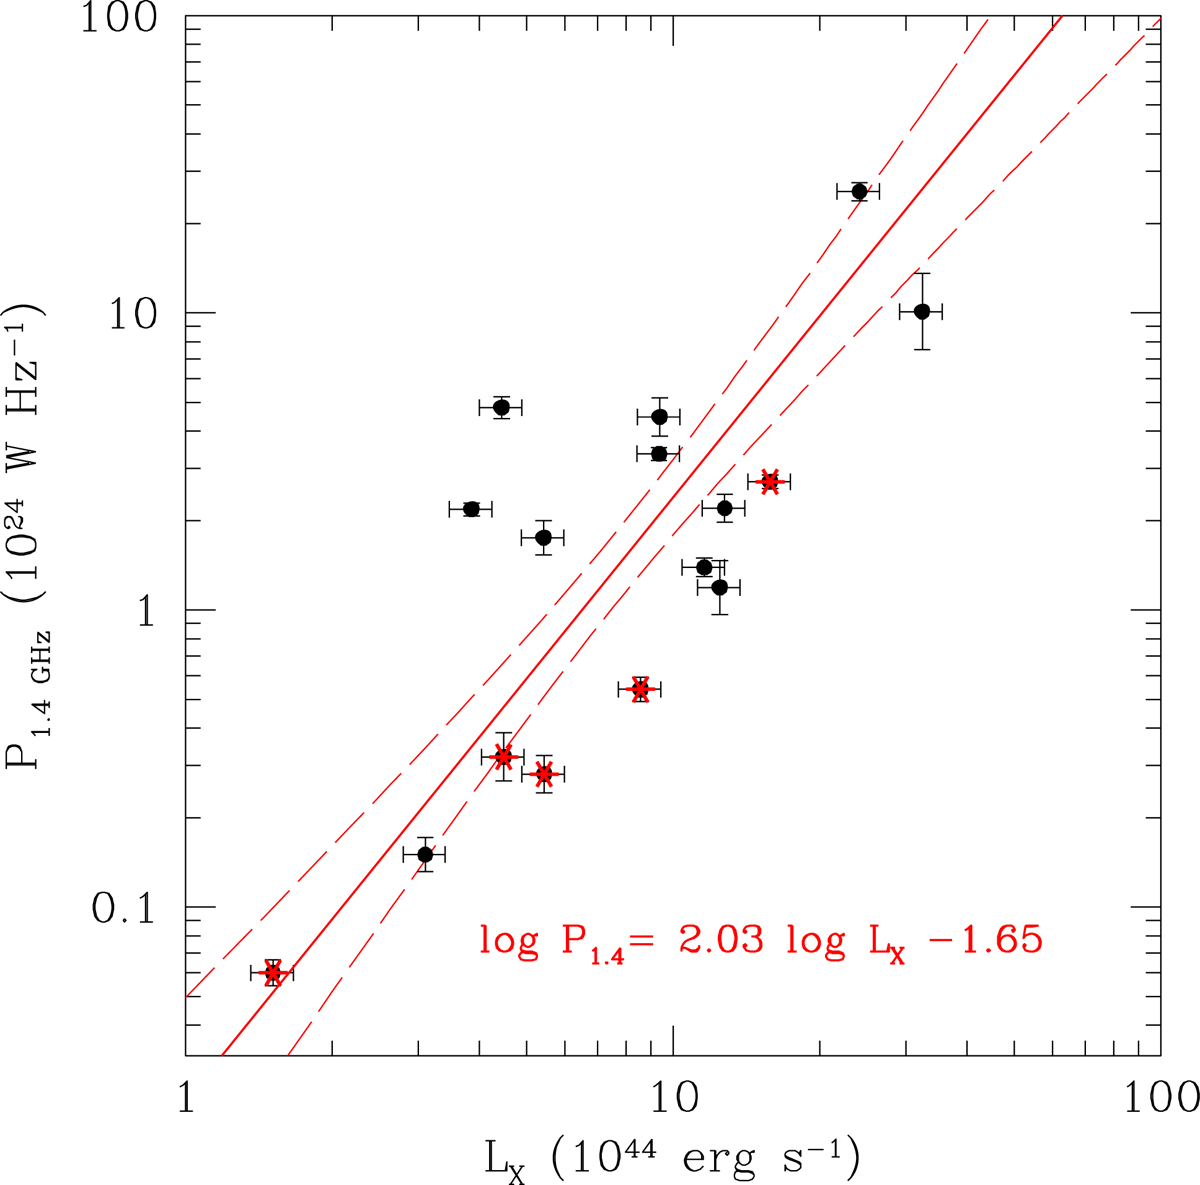
Radio power at 1.4 GHz versus the X-ray luminosity inside R500 (taken from Piffaretti et al. 2011,and converted into the 0.5–2.0 keV band) for the mini-halo sample. The red solid line is the best-fit relation (see Eq. (1)), enclosed by the 1σ confidence lines (red dashed). The clusters belonging to the HIFLUGCS sample are highlighted with red stars.
Current usage metrics show cumulative count of Article Views (full-text article views including HTML views, PDF and ePub downloads, according to the available data) and Abstracts Views on Vision4Press platform.
Data correspond to usage on the plateform after 2015. The current usage metrics is available 48-96 hours after online publication and is updated daily on week days.
Initial download of the metrics may take a while.