Fig. 1.
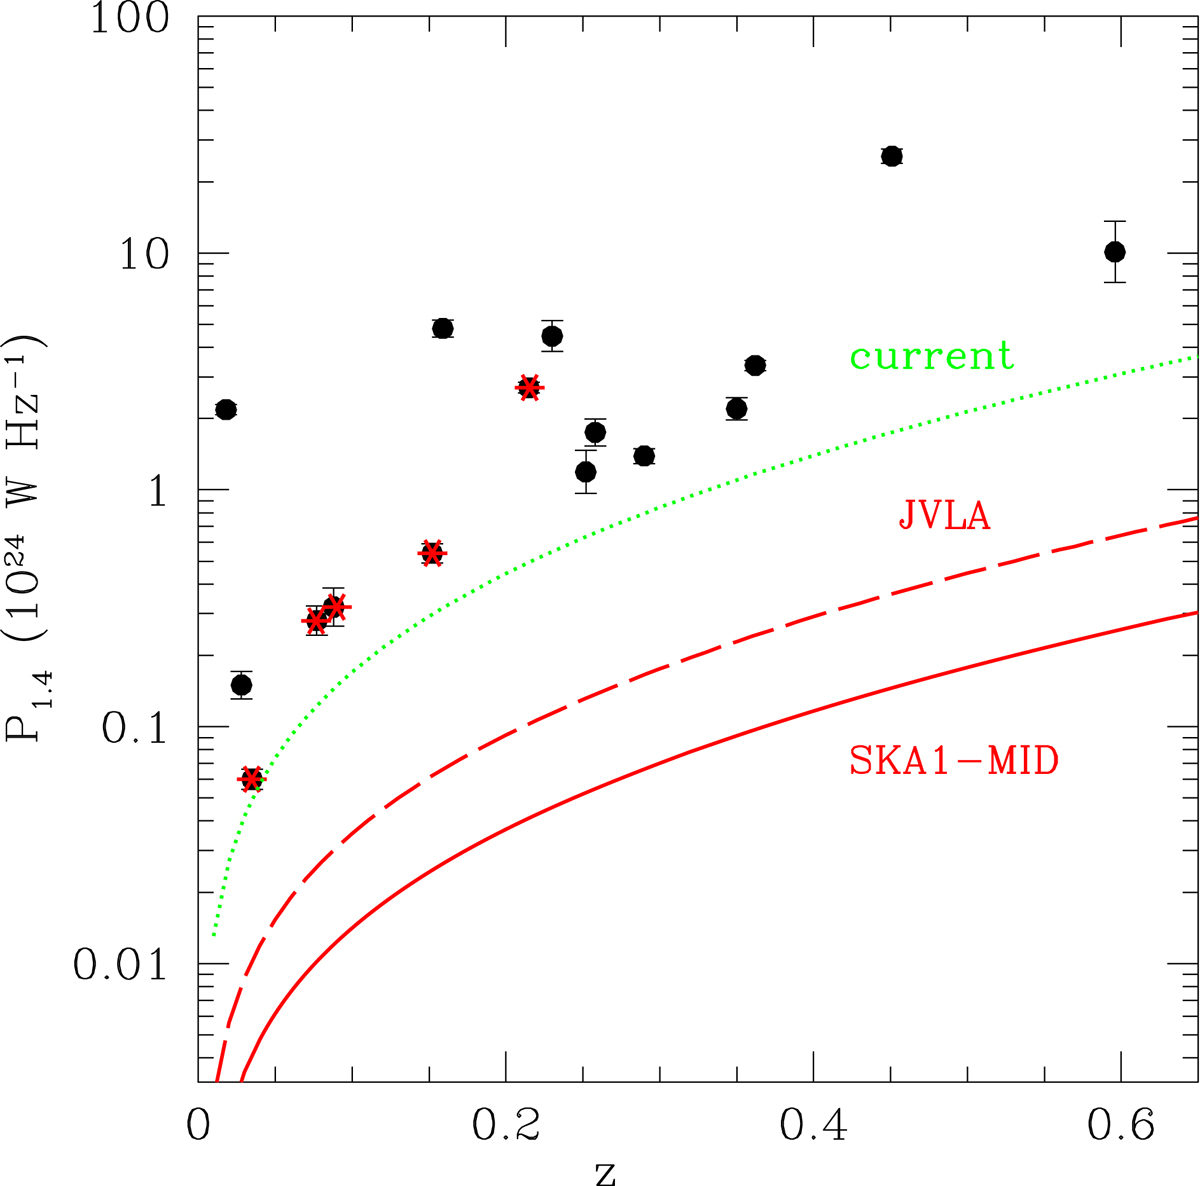
Radio power at 1.4 GHz (from Giacintucci et al. 2014b; van Weeren et al. 2014) versus redshift of the sample of 16 confirmed mini-halos known up to 2016 (sorted by decreasing radio power at 1.4 GHz): RX J1347.5−1145 (z = 0.451), Phoenix (z = 0.596), RX J1720.1+2638 (z = 0.159), A 2390 (z = 0.23), RX J1532.9+3021 (z = 0.362), RXC J1504.1−0248 (z = 0.215), RBS 797 (z = 0.35), Perseus (z = 0.018), MS 1455.0+2232 (z = 0.258), ZwCl 3146 (z = 0.290), A 1835 (z = 0.252), A 2204 (z = 0.152), A 478 (z = 0.088), A 2029 (z = 0.077), Ophiuchus (z = 0.028), and 2A 0335+096 (z = 0.035). The clusters belonging to the HIFLUGCS sample are highlighted with red stars. The green dotted line is indicative of the existing detection limit reached in the literature with pointed observations. The red dashed and solid lines are the detection limits achievable with JVLA and SKA1-MID, respectively, with the performances adopted in Table 1 (see Sect. 3.1).
Current usage metrics show cumulative count of Article Views (full-text article views including HTML views, PDF and ePub downloads, according to the available data) and Abstracts Views on Vision4Press platform.
Data correspond to usage on the plateform after 2015. The current usage metrics is available 48-96 hours after online publication and is updated daily on week days.
Initial download of the metrics may take a while.