Open Access
Fig. 4.
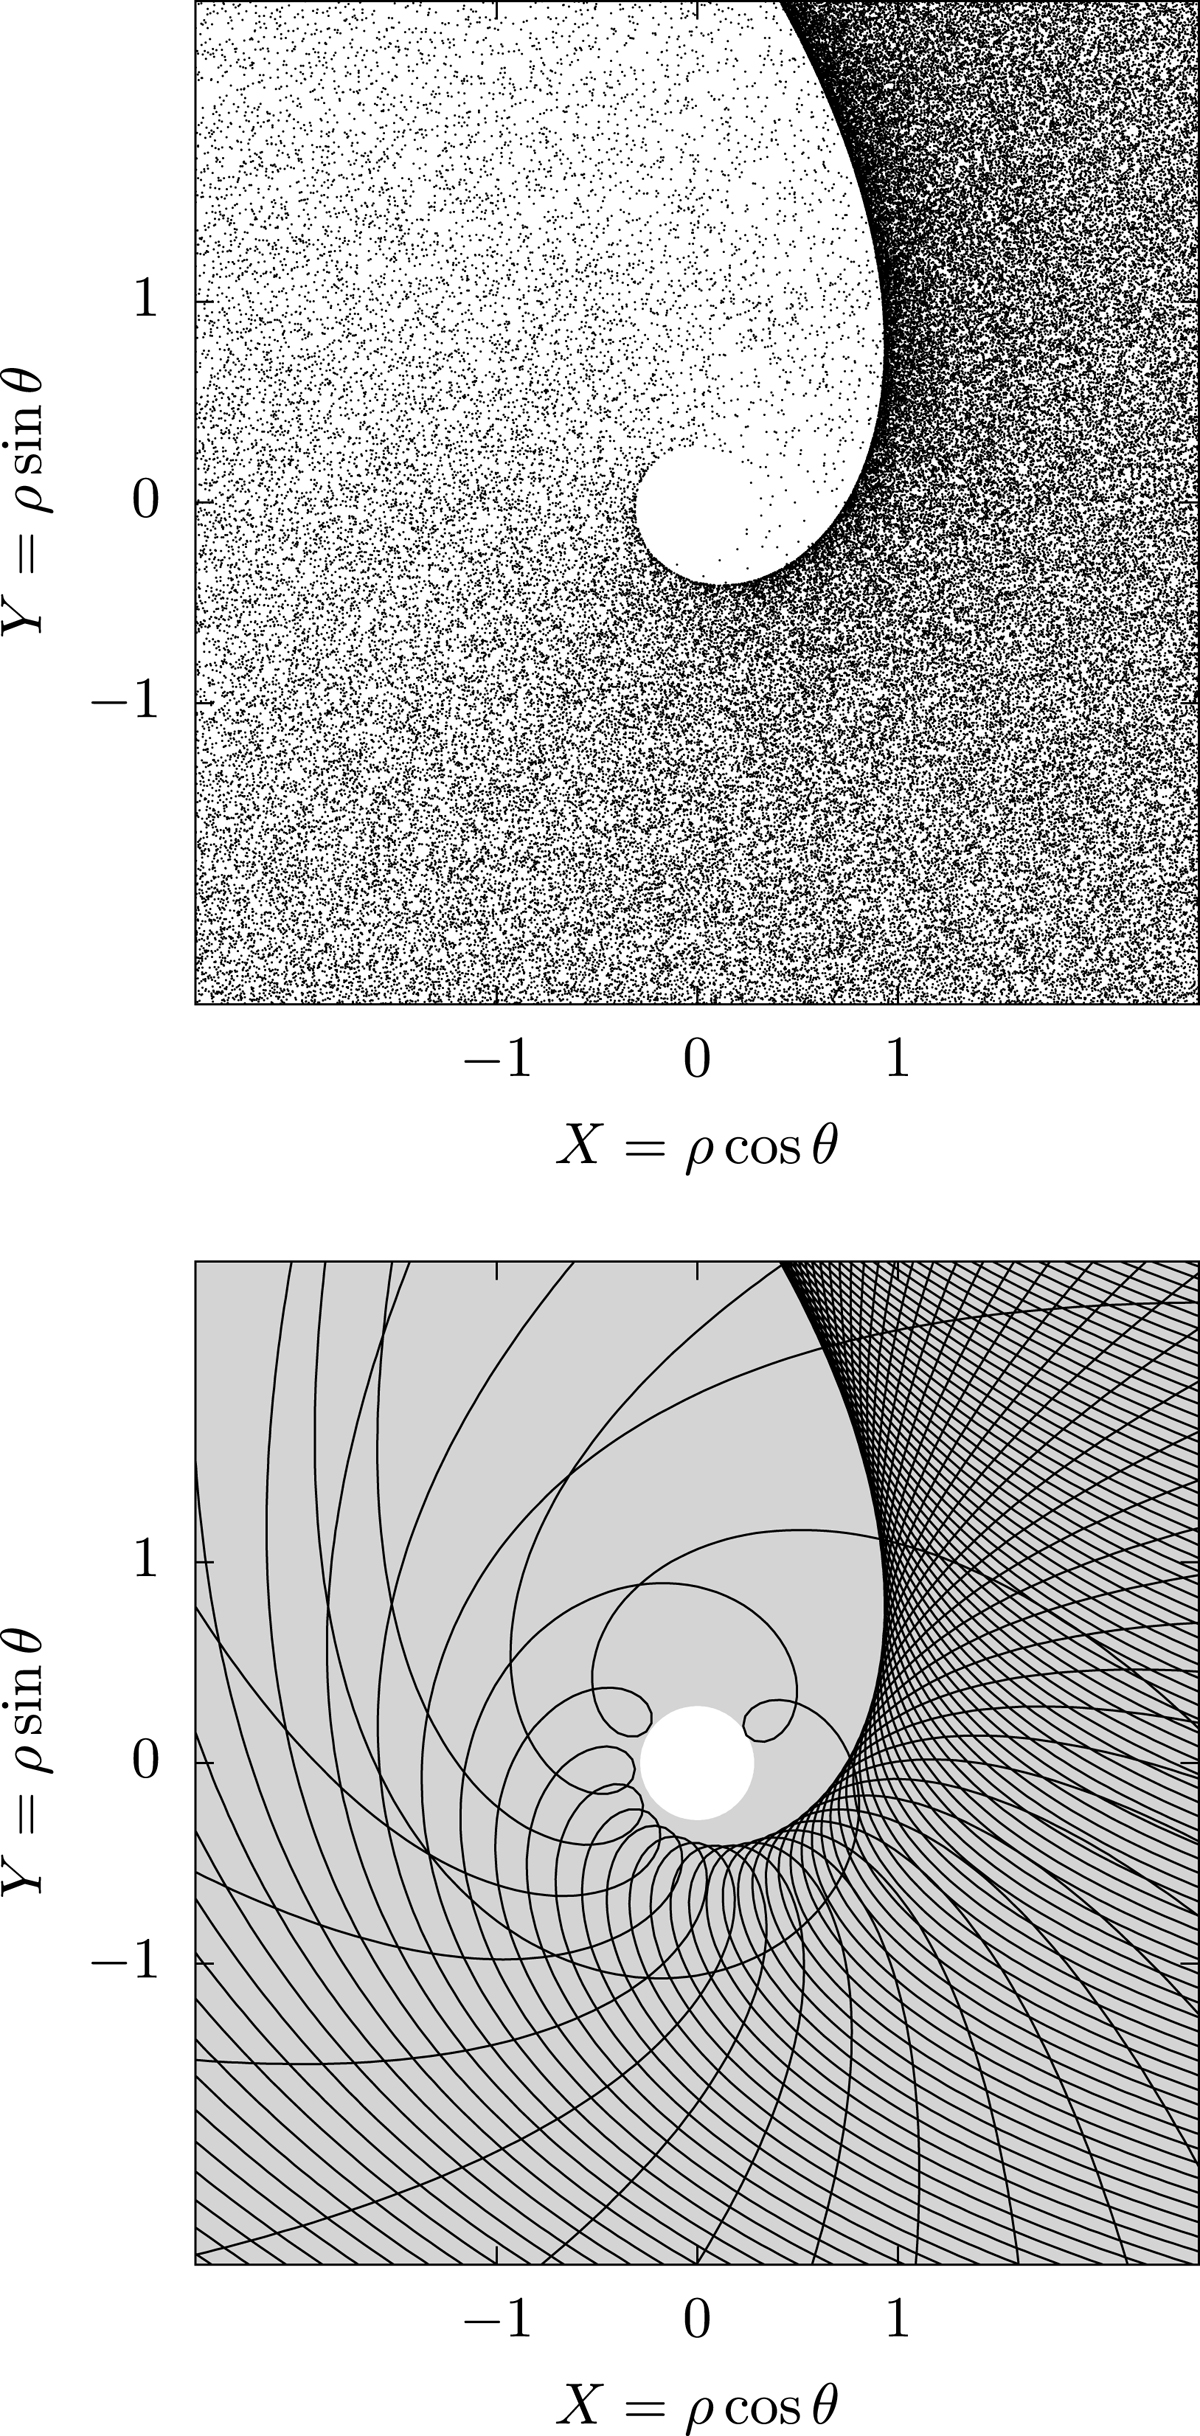
Top: simulated density map of the particles around the origin for D → ∞ (the particles come from the right). The inner cavity of radius ρcav = W0(exp[−1]) is visible, as well as a caustic (line of overdensity). Bottom: some trajectories evenly sampled along ln(ρC) are shown. The cavity is represented by the white disc.
Current usage metrics show cumulative count of Article Views (full-text article views including HTML views, PDF and ePub downloads, according to the available data) and Abstracts Views on Vision4Press platform.
Data correspond to usage on the plateform after 2015. The current usage metrics is available 48-96 hours after online publication and is updated daily on week days.
Initial download of the metrics may take a while.