Fig. 3.
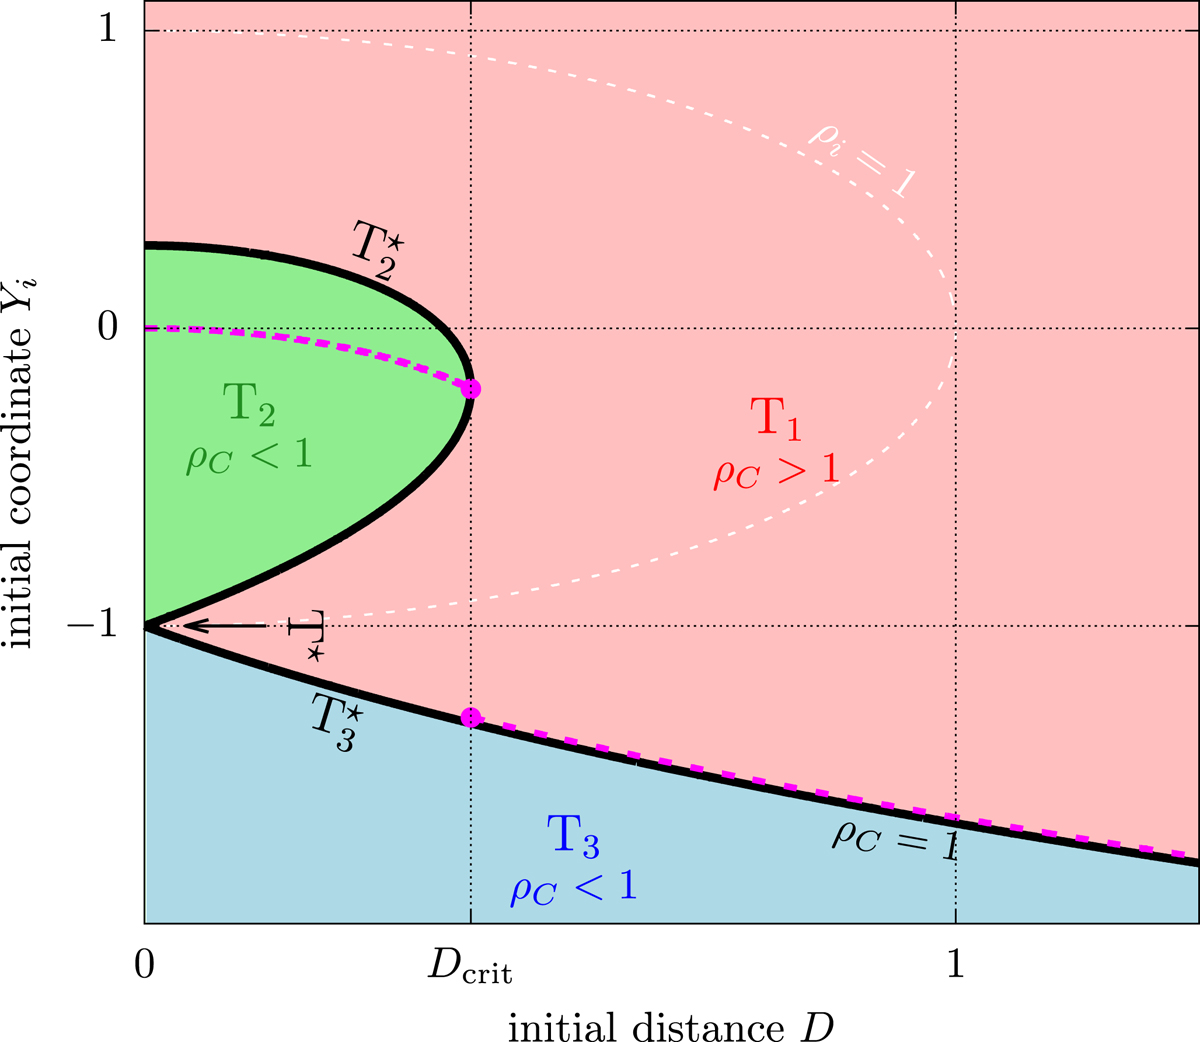
Type of orbit followed by a particle as a function of its initial position (D, Yi). The regions are coloured according to the value of ρC(D,Yi), and the level ρC = 1 is represented by the black line. The types of orbits are labelled as in (Eq. (20)). The magenta dashed line shows the initial position of the trajectory reaching the minimum radius over the whole vertical line. For D < Dcrit, it is a trajectory of type T2. For D > Dcrit, it is a trajectory of type T1 but infinitely close to the ρC = 1 curve (see text).
Current usage metrics show cumulative count of Article Views (full-text article views including HTML views, PDF and ePub downloads, according to the available data) and Abstracts Views on Vision4Press platform.
Data correspond to usage on the plateform after 2015. The current usage metrics is available 48-96 hours after online publication and is updated daily on week days.
Initial download of the metrics may take a while.