Fig. B.2
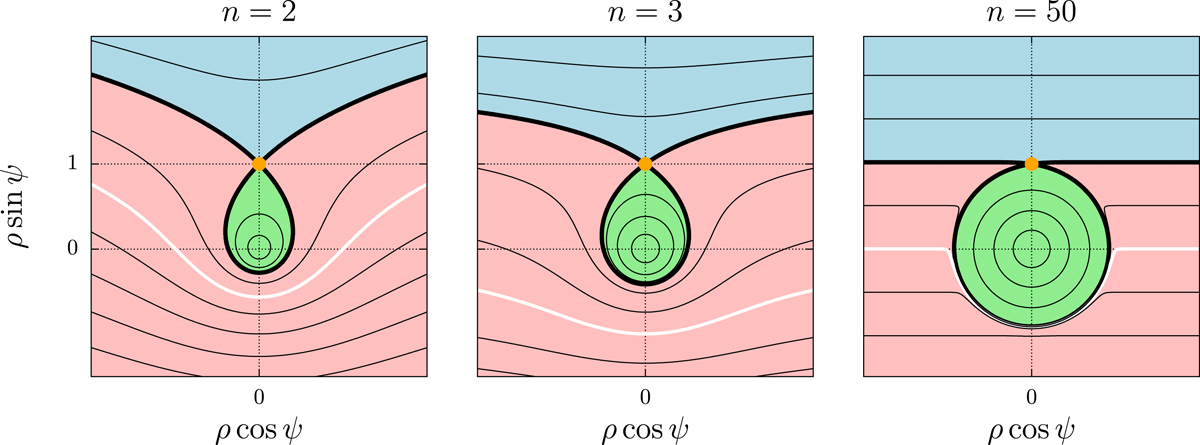
Phase portraits of the system in the plane (ρ,ψ) for different powers n, obtained in terms of the level curves of γn (with, in particular, γ2 = −ln ρ0). Trajectories of type T1, T2, and T3 are plotted respectively in red, green, and blue. The thick black curve represents the unit level (separatrix). Along it lie the homoclinic orbit ![]() and the two branches of the
and the two branches of the ![]() orbit, whereas the circular trajectory T⋆ is plotted in orange. The white level curve represents the zero level. For n > 2, it always remains in the ρsinψ < 0 side.
orbit, whereas the circular trajectory T⋆ is plotted in orange. The white level curve represents the zero level. For n > 2, it always remains in the ρsinψ < 0 side.
Current usage metrics show cumulative count of Article Views (full-text article views including HTML views, PDF and ePub downloads, according to the available data) and Abstracts Views on Vision4Press platform.
Data correspond to usage on the plateform after 2015. The current usage metrics is available 48-96 hours after online publication and is updated daily on week days.
Initial download of the metrics may take a while.