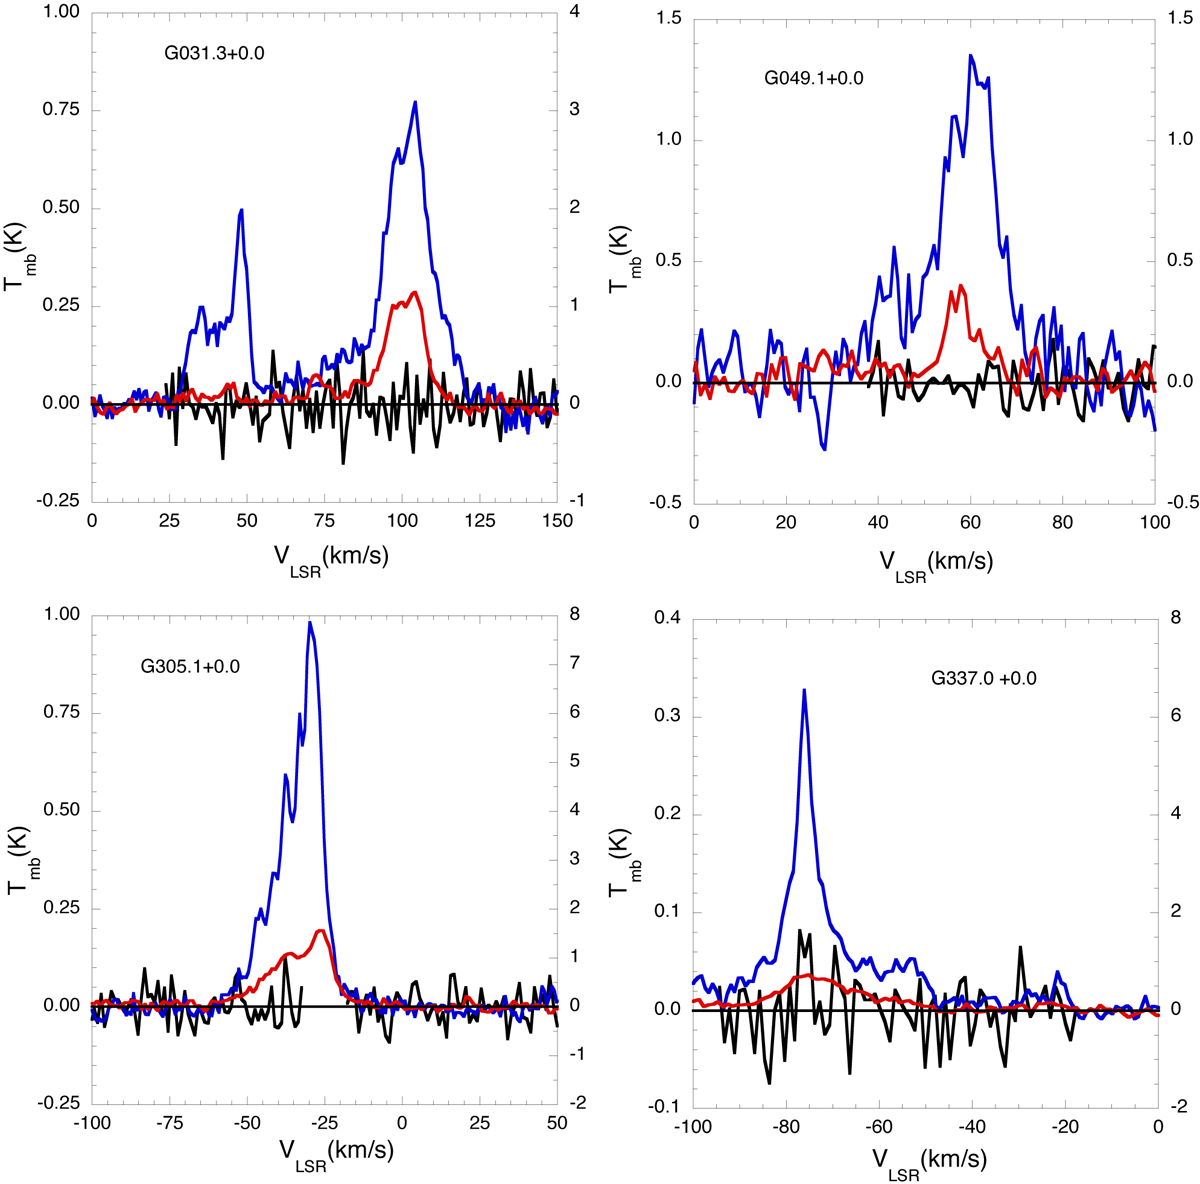
Fig. 1

Main beam temperature versus velocity for the [O I] (black) GREAT HFA-band spectra for four lines of sight. The scale for [O I] is on the left and the scale for [C II] and [N II] is on the right. There is a 3.5-σ detection at G337.0+0.0, but only upper limits for the other three LOS. There is an emission gap in [O I] for G305.1+0.0 due to the presence of an atmospheric absorption line which has been removed. Superimposed on the [O I] spectra are the corresponding HIFI [C II] (blue) and [N II] (red) spectra (Langer et al. 2016).
Current usage metrics show cumulative count of Article Views (full-text article views including HTML views, PDF and ePub downloads, according to the available data) and Abstracts Views on Vision4Press platform.
Data correspond to usage on the plateform after 2015. The current usage metrics is available 48-96 hours after online publication and is updated daily on week days.
Initial download of the metrics may take a while.


