Fig. 7.
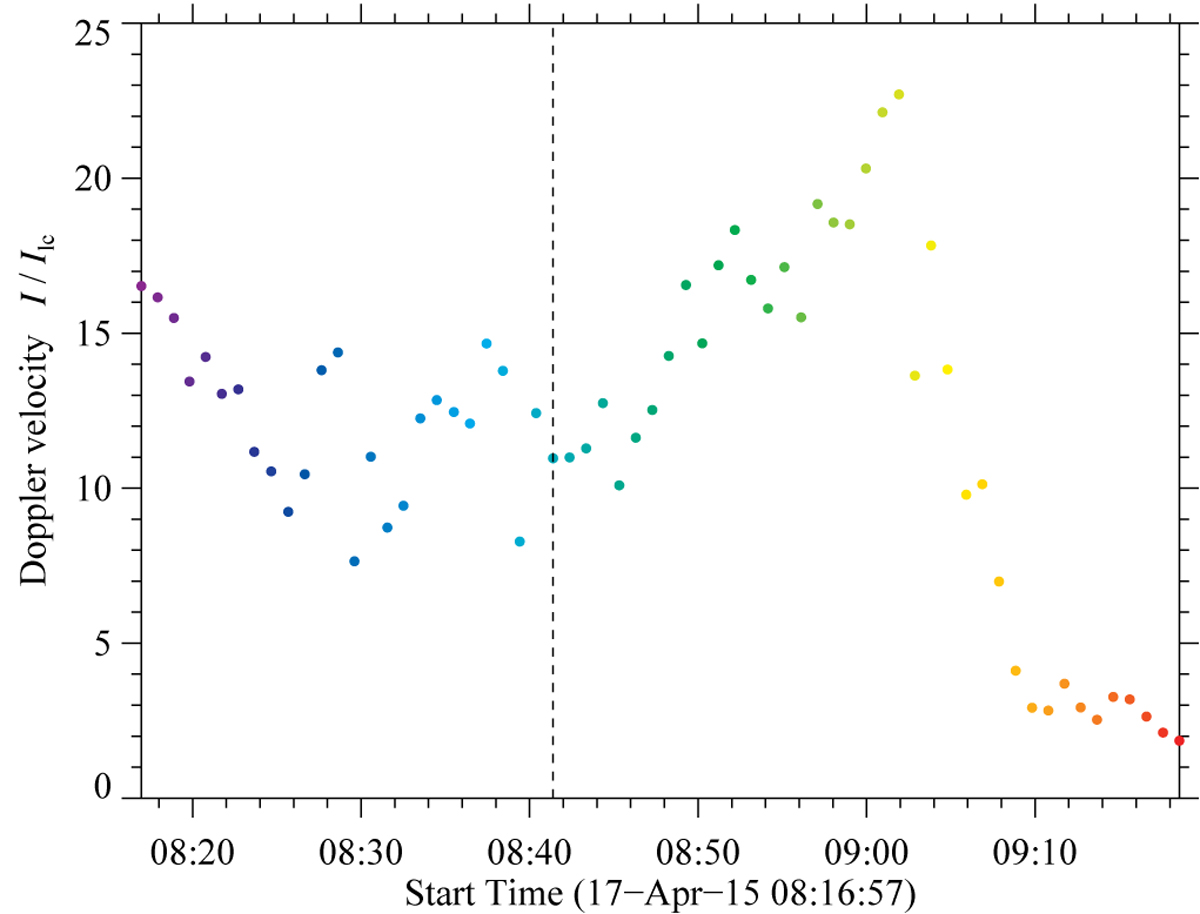
Temporal evolution of the average Doppler velocities based on the He I triplet’s red component in Fig. 6. The Doppler velocities were calculated either for a single flow component or refer to the fast component when dual flow components are present. The colors refer to the same profiles and times as in Fig. 6. The dashed vertical line marks the time when the profile shape starts to change rapidly with time in Fig. 6.
Current usage metrics show cumulative count of Article Views (full-text article views including HTML views, PDF and ePub downloads, according to the available data) and Abstracts Views on Vision4Press platform.
Data correspond to usage on the plateform after 2015. The current usage metrics is available 48-96 hours after online publication and is updated daily on week days.
Initial download of the metrics may take a while.