Fig. 6.
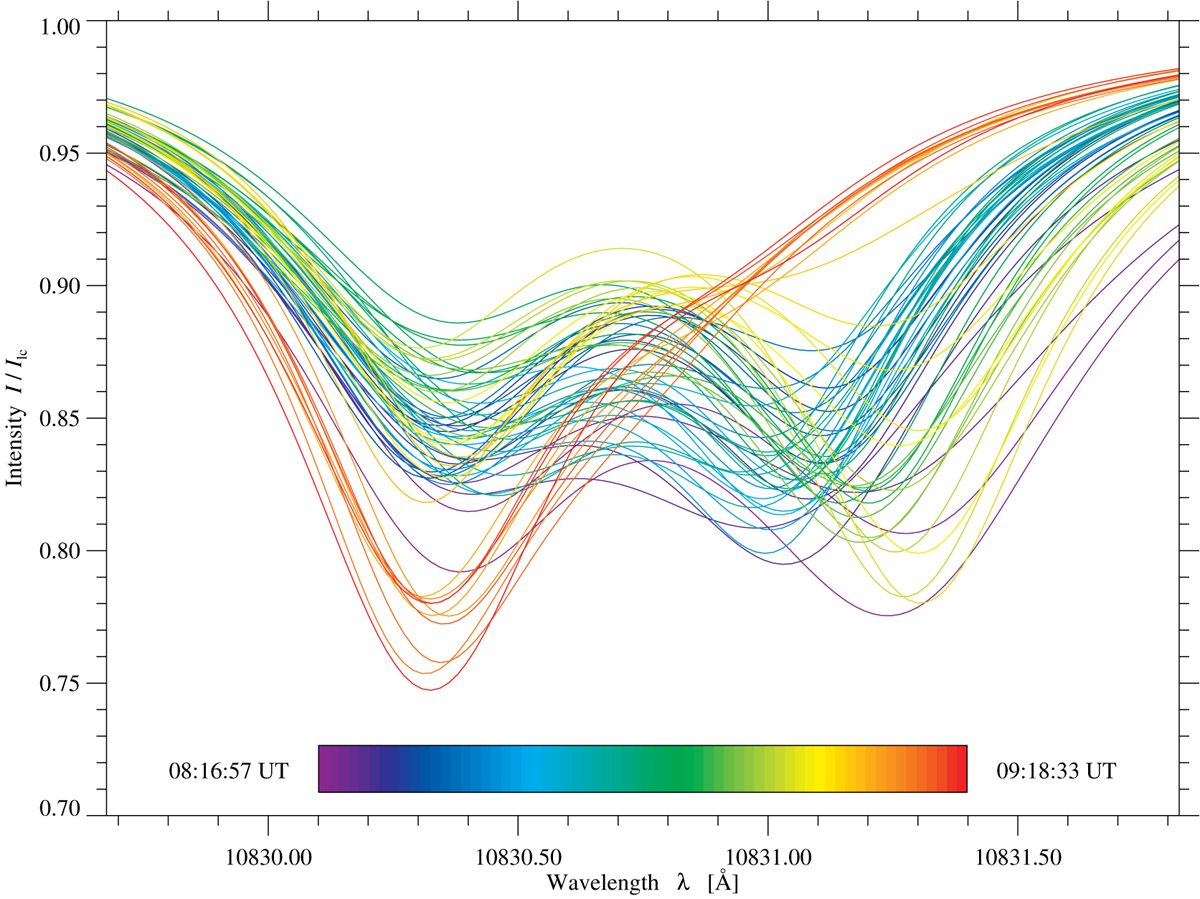
Temporal evolution of the fitted spectral profiles (normalized to the local continuum intensity Ilc) for the red component of the He I triplet. The rainbow-colored bar indicates the elapsed time after the start of the one-hour time series. The spectra were taken at a strong downflow kernel marked by a blue filled circle in the second panel of Fig. 3. These profiles are an average of all fitted spectral profiles within the blue patch and do not refer to individual fits. The spectra were slightly smoothed to avoid a cluttered display.
Current usage metrics show cumulative count of Article Views (full-text article views including HTML views, PDF and ePub downloads, according to the available data) and Abstracts Views on Vision4Press platform.
Data correspond to usage on the plateform after 2015. The current usage metrics is available 48-96 hours after online publication and is updated daily on week days.
Initial download of the metrics may take a while.