Fig. 3.
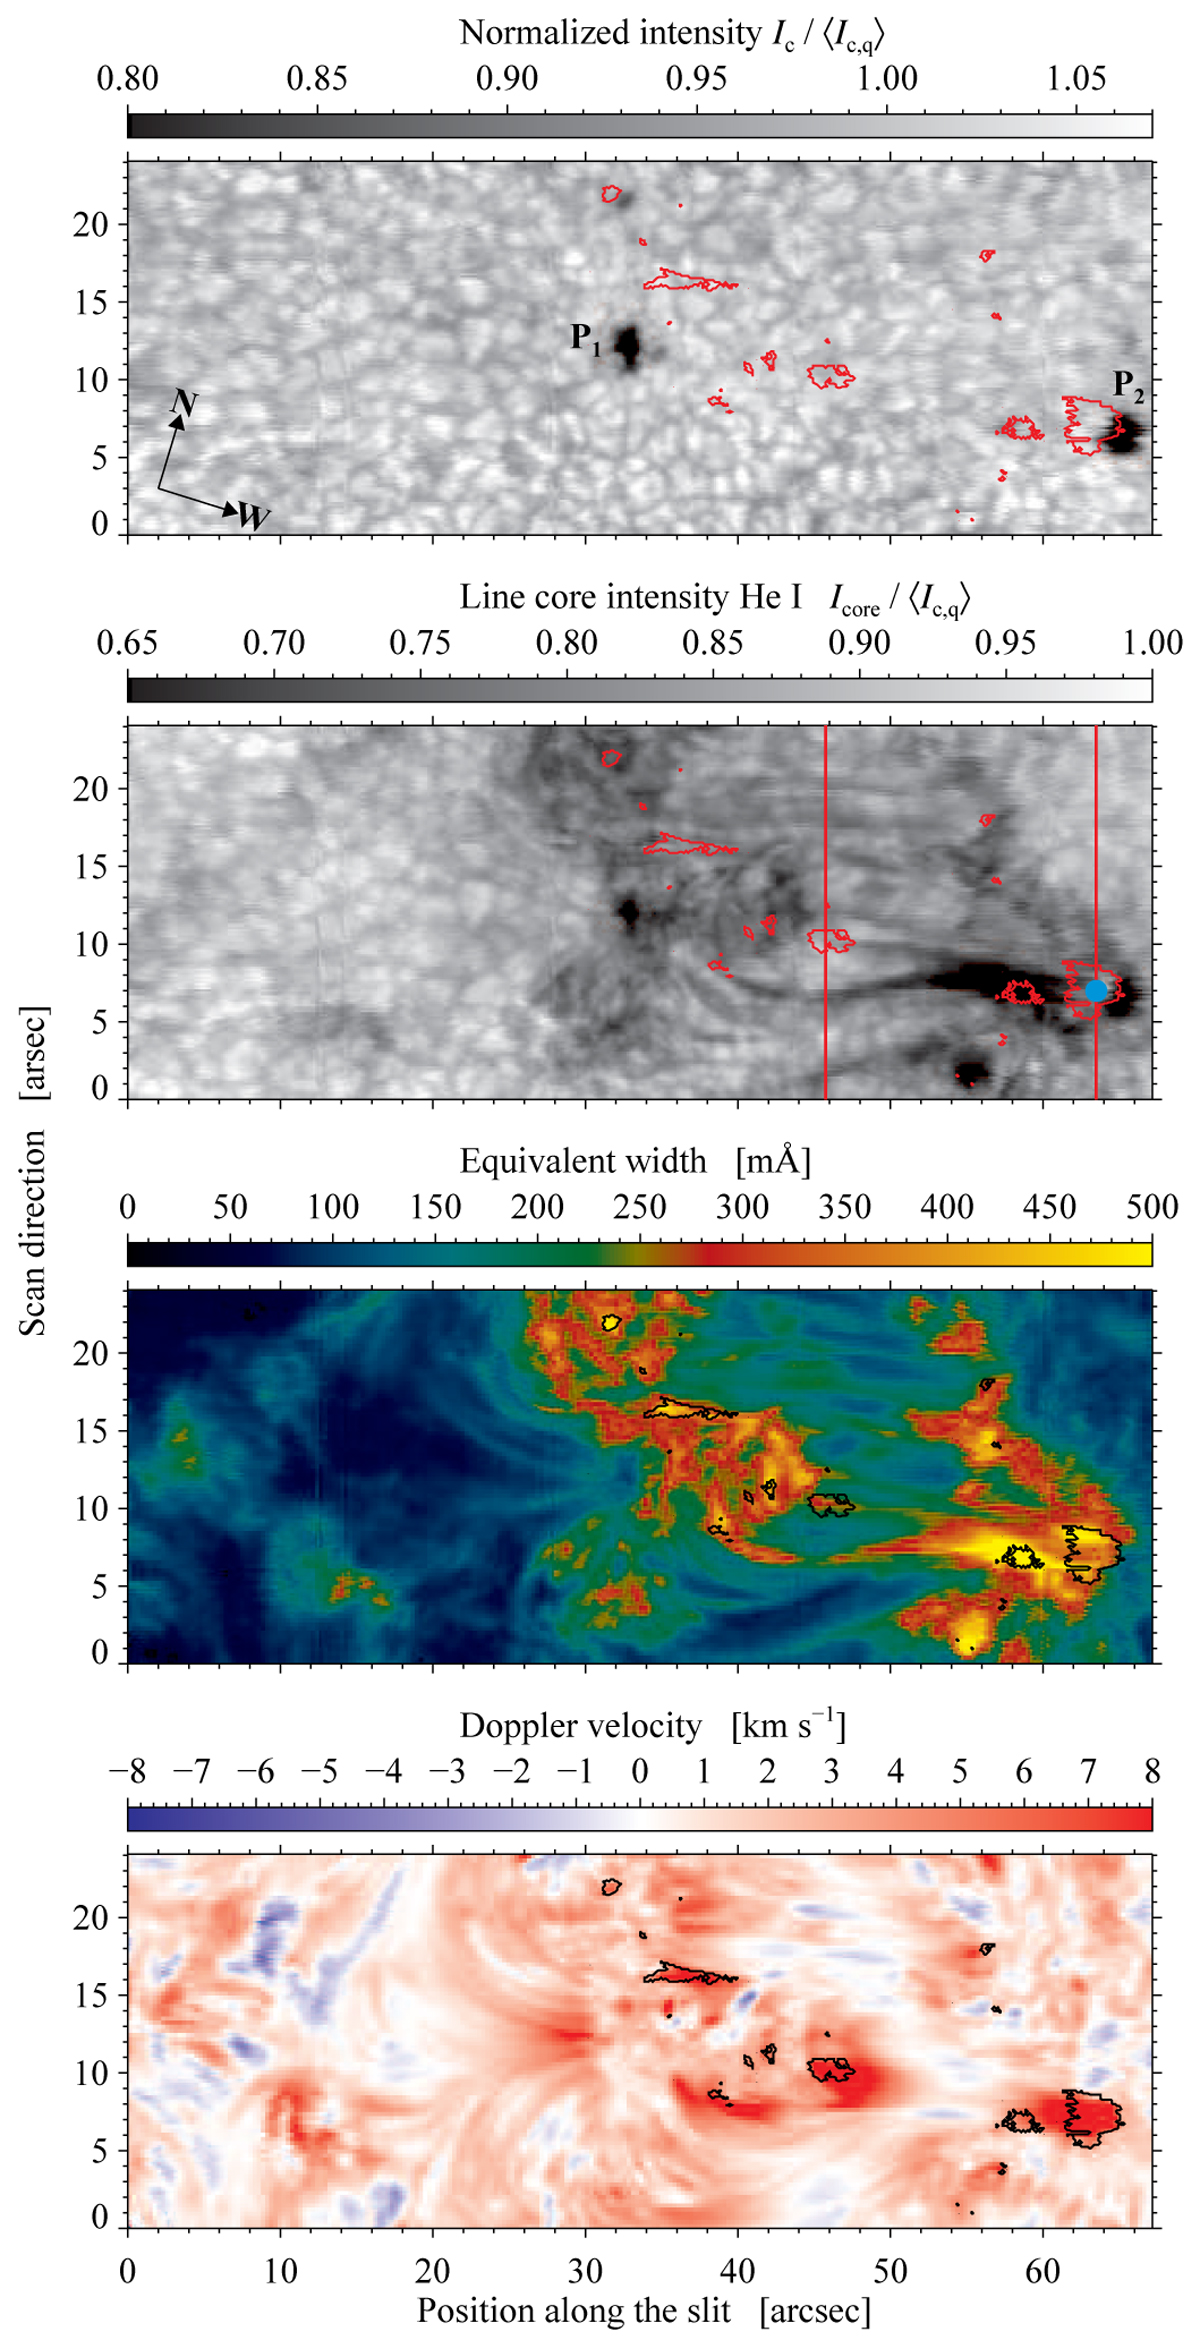
Slit-reconstructed GRIS images at 09:00:56 UT on 2015 April 17 of the EFR centered on the pore P1 with negative polarity shown in Fig. 1: continuum intensity, line core intensity of the red component of the He I triplet, equivalent width, and He I Doppler velocity calculated assuming only a single flow component (top to bottom). The blue filled circle (second panel from top) refers to the location of strong downflows near the pore P2, and it is used to calculate the average profiles in Fig. 6. The contours encompass dual-flow He I profiles. The red vertical lines indicate positions of the space-time diagrams (the right line corresponds to the upper panel of Fig. 10). The temporal evolution of the He I line depression and Doppler shifts is available as an online movie covering the period between 08:16:57 UT and 09:18:33 UT.
Current usage metrics show cumulative count of Article Views (full-text article views including HTML views, PDF and ePub downloads, according to the available data) and Abstracts Views on Vision4Press platform.
Data correspond to usage on the plateform after 2015. The current usage metrics is available 48-96 hours after online publication and is updated daily on week days.
Initial download of the metrics may take a while.