Free Access
Fig. 15.
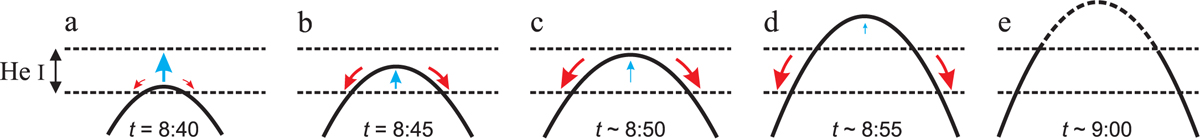
Cartoon of the evolution of an individual arch filament (from panels a–e). Arrows in blue and red mark the direction of the plasma flows as observed in the He I triplet, respectively. The stronger the downflows (red), the thicker the arrow. The He I layer lies between the two dashed lines.
Current usage metrics show cumulative count of Article Views (full-text article views including HTML views, PDF and ePub downloads, according to the available data) and Abstracts Views on Vision4Press platform.
Data correspond to usage on the plateform after 2015. The current usage metrics is available 48-96 hours after online publication and is updated daily on week days.
Initial download of the metrics may take a while.