Fig. 14.
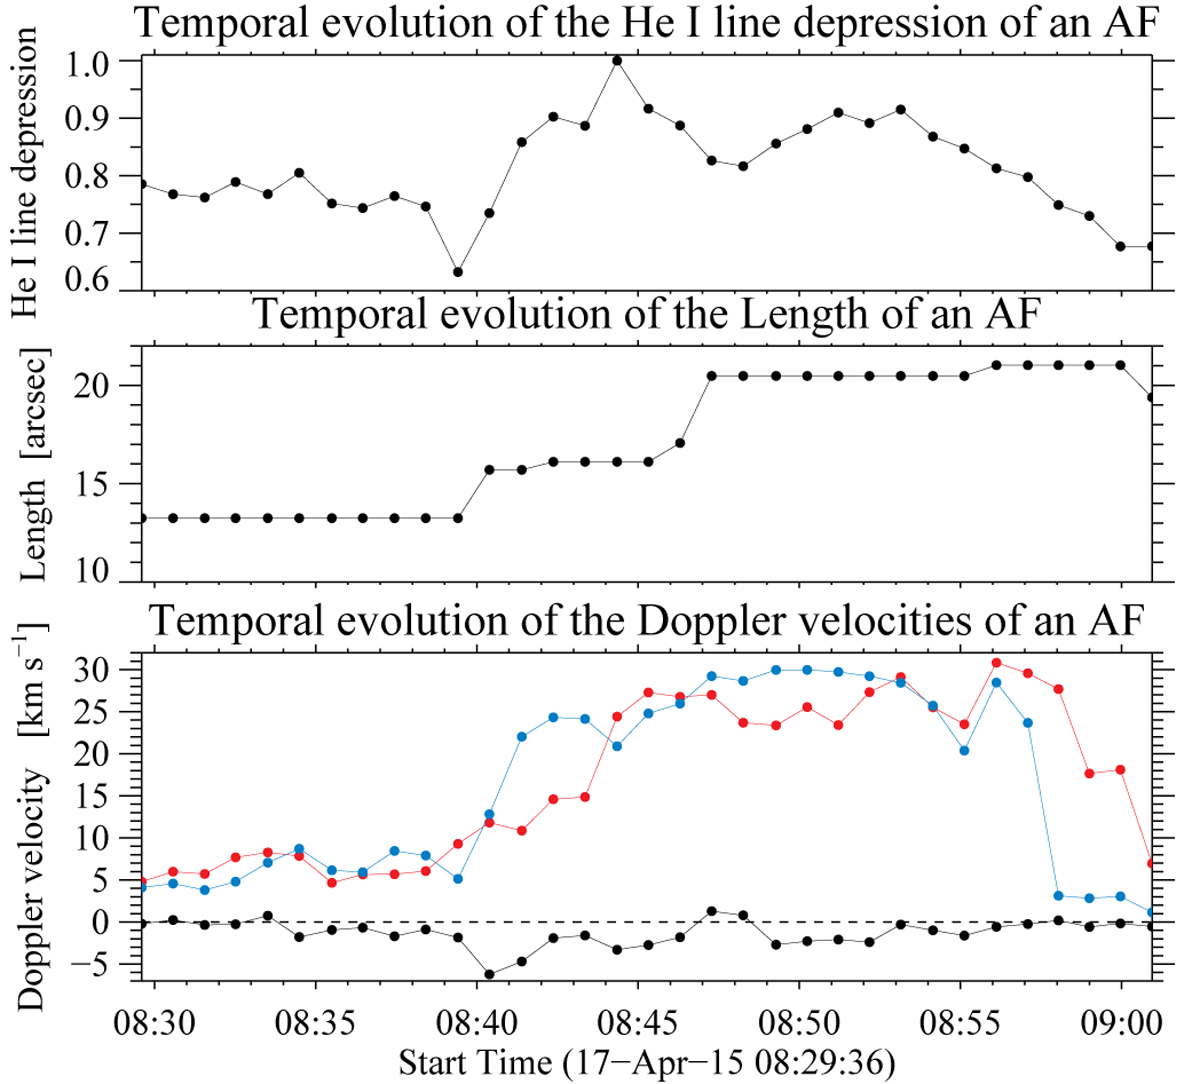
Temporal evolution of the normalized mean He I line depression of the whole arch filament (upper panel). The highest value is the darkest. Temporal evolution of the length of the individual arch filament (middle panel). Temporal evolution of the mean Doppler velocities of the individual arch filament (lower panel) shown in Fig. 13. The Doppler velocities were calculated based on either single- or dual-flow components. The black bullets represent the mean Doppler velocities at the loop top and the blue and red bullets indicate the mean Doppler velocities at the left and right footpoints, respectively.
Current usage metrics show cumulative count of Article Views (full-text article views including HTML views, PDF and ePub downloads, according to the available data) and Abstracts Views on Vision4Press platform.
Data correspond to usage on the plateform after 2015. The current usage metrics is available 48-96 hours after online publication and is updated daily on week days.
Initial download of the metrics may take a while.