Fig. 10.
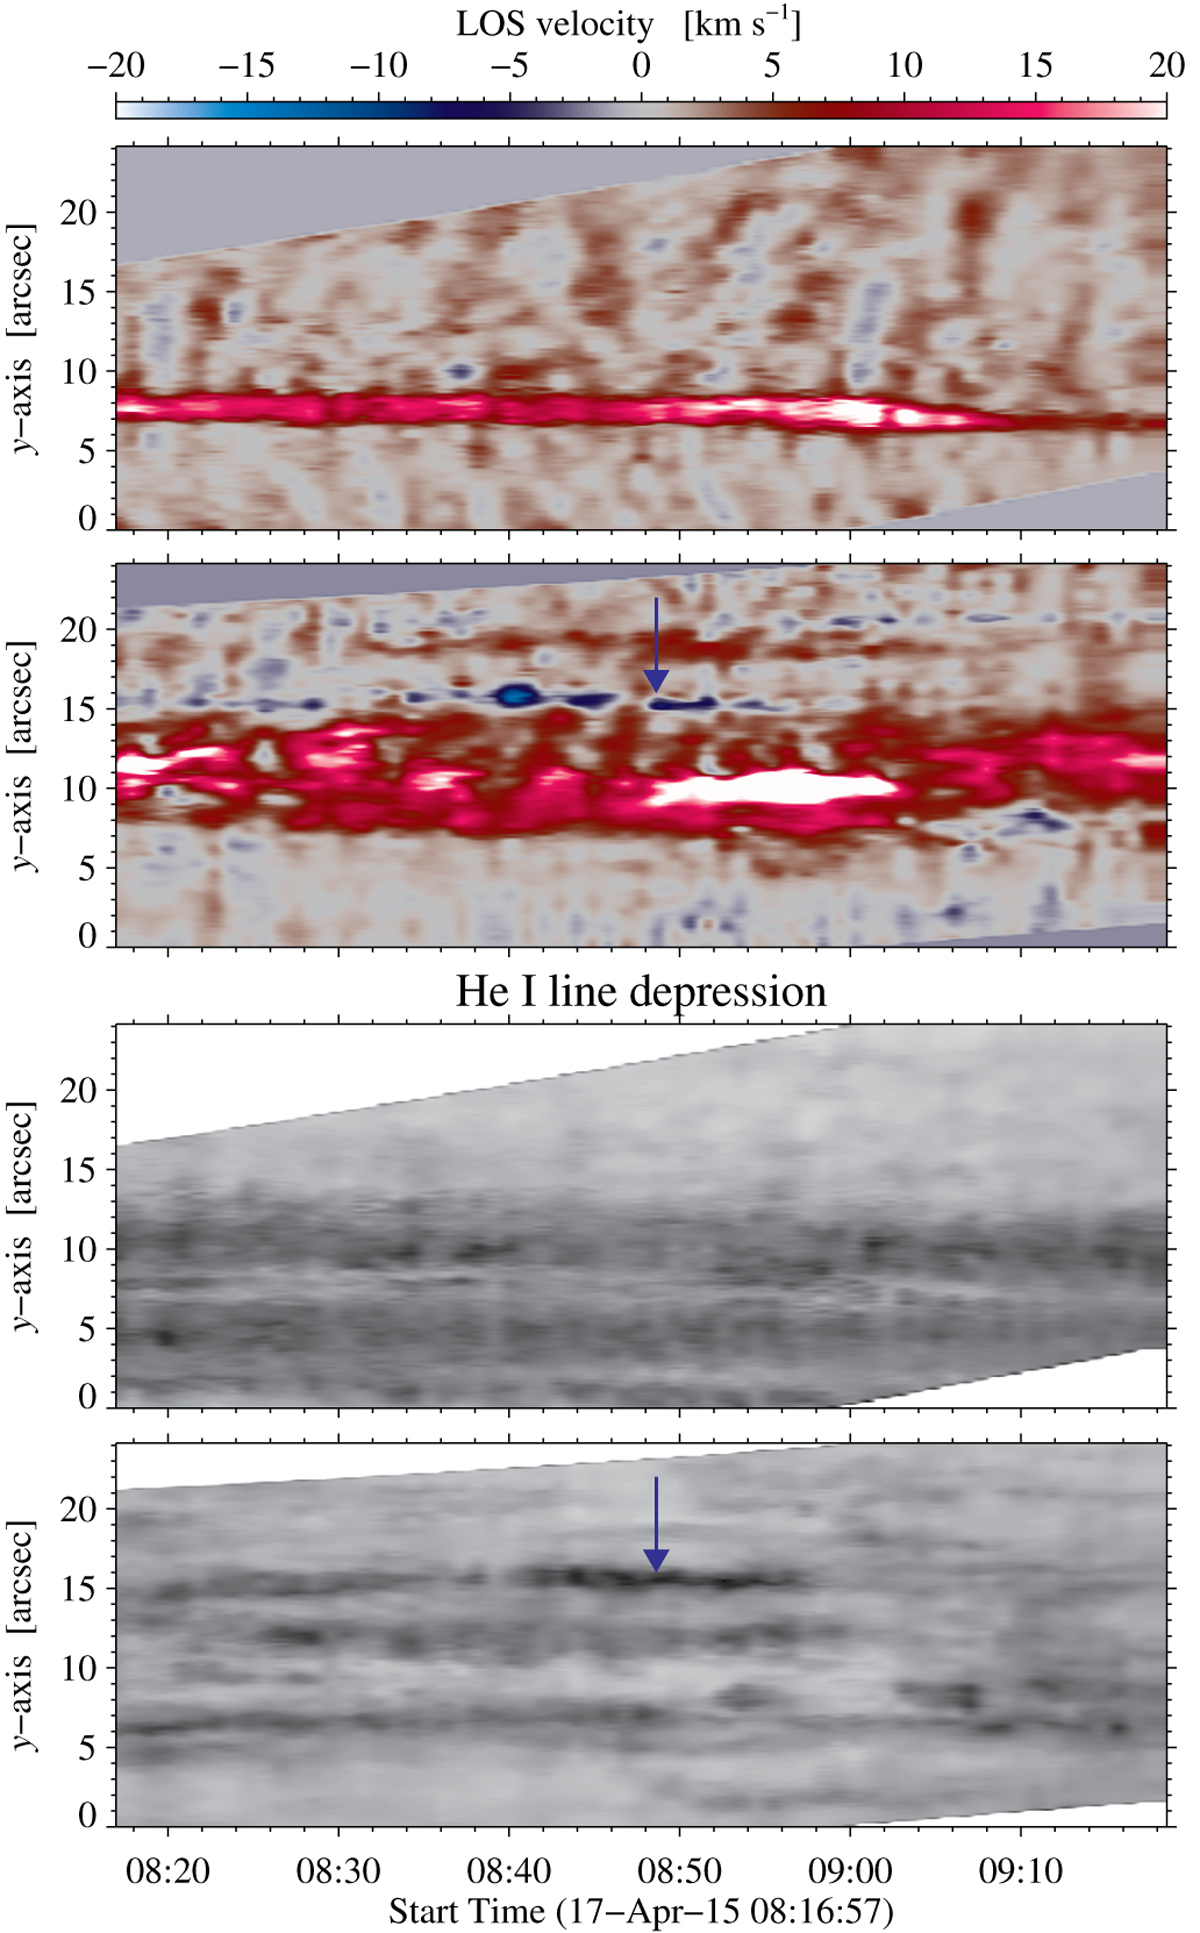
Space-time diagrams of the He I Doppler velocity based on single-component fits (top two panels) and the He I line depression (bottom two panels). Both quantities are displayed for a footpoint (top and third panel) and a loop top (second and bottom panel) position of an arch filament. These positions are marked in Fig. 3 by vertical red lines. The reference rotation image is the same as presented in Fig. 3. The blue arrow points out the individual arch filament in Figs. 13 and 14. The Doppler velocities were calculated assuming single- or dual-flow components when present.
Current usage metrics show cumulative count of Article Views (full-text article views including HTML views, PDF and ePub downloads, according to the available data) and Abstracts Views on Vision4Press platform.
Data correspond to usage on the plateform after 2015. The current usage metrics is available 48-96 hours after online publication and is updated daily on week days.
Initial download of the metrics may take a while.