Fig. 1.
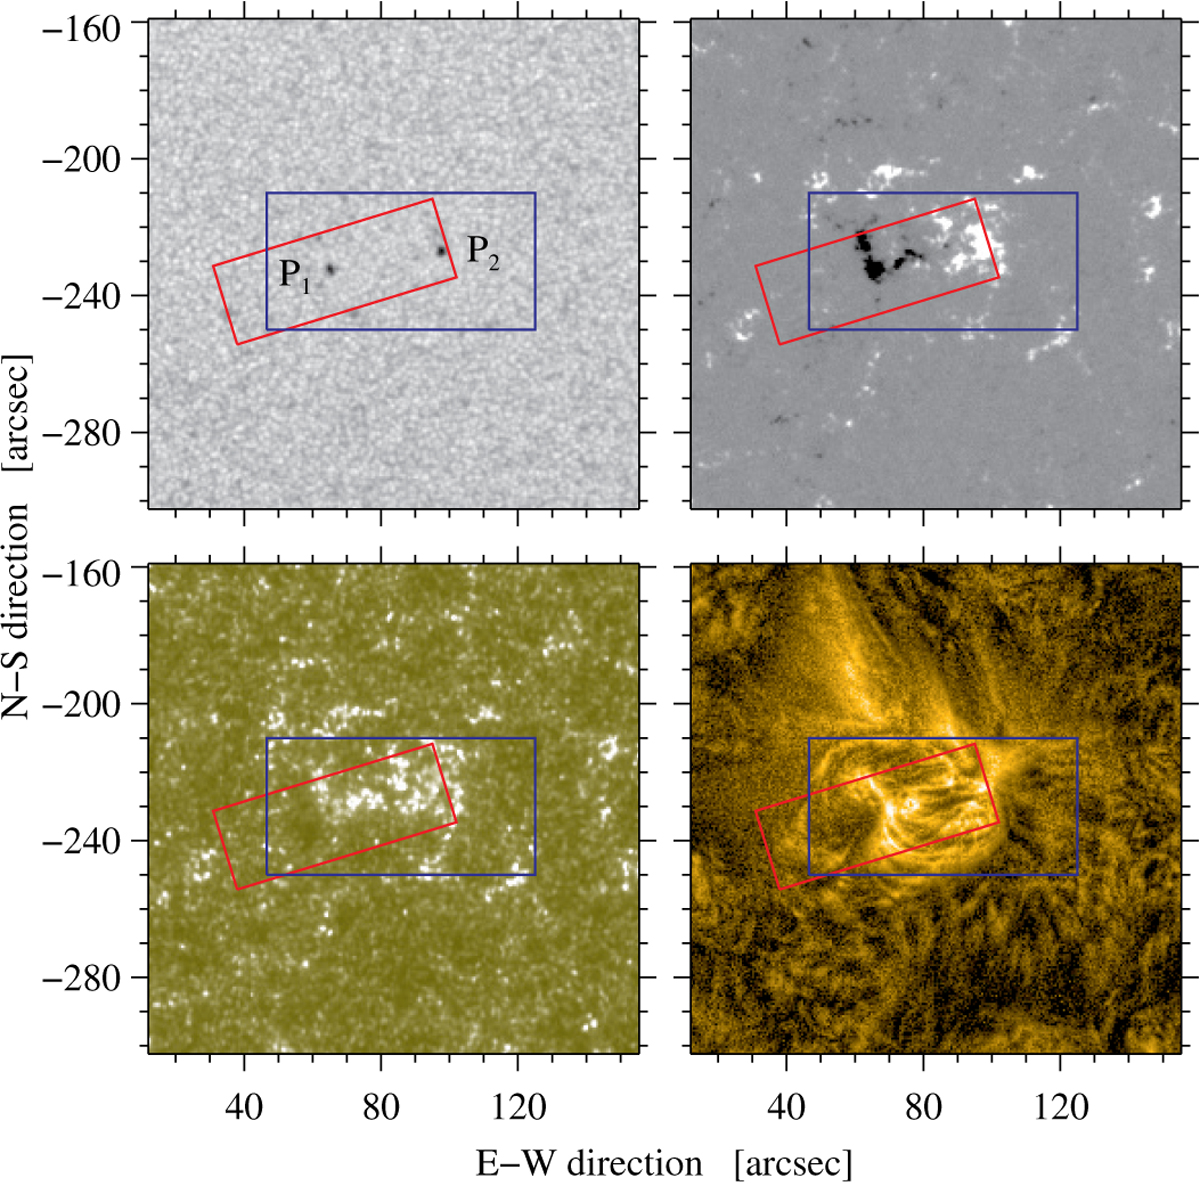
Overview of the EFR at 09:00 UT on 2015 April 17: SDO HMI continuum image (top left), HMI magnetogram (top right), AIA 1600 Å image (bottom left), and NAFE-corrected AIA Fe IX 171 Å image (bottom right). The red rectangle delineates the FOV covered by GRIS. The blue rectangle represents the FOV where the temporal evolution of the magnetic flux was calculated (see Fig. 4).
Current usage metrics show cumulative count of Article Views (full-text article views including HTML views, PDF and ePub downloads, according to the available data) and Abstracts Views on Vision4Press platform.
Data correspond to usage on the plateform after 2015. The current usage metrics is available 48-96 hours after online publication and is updated daily on week days.
Initial download of the metrics may take a while.