Fig. 2
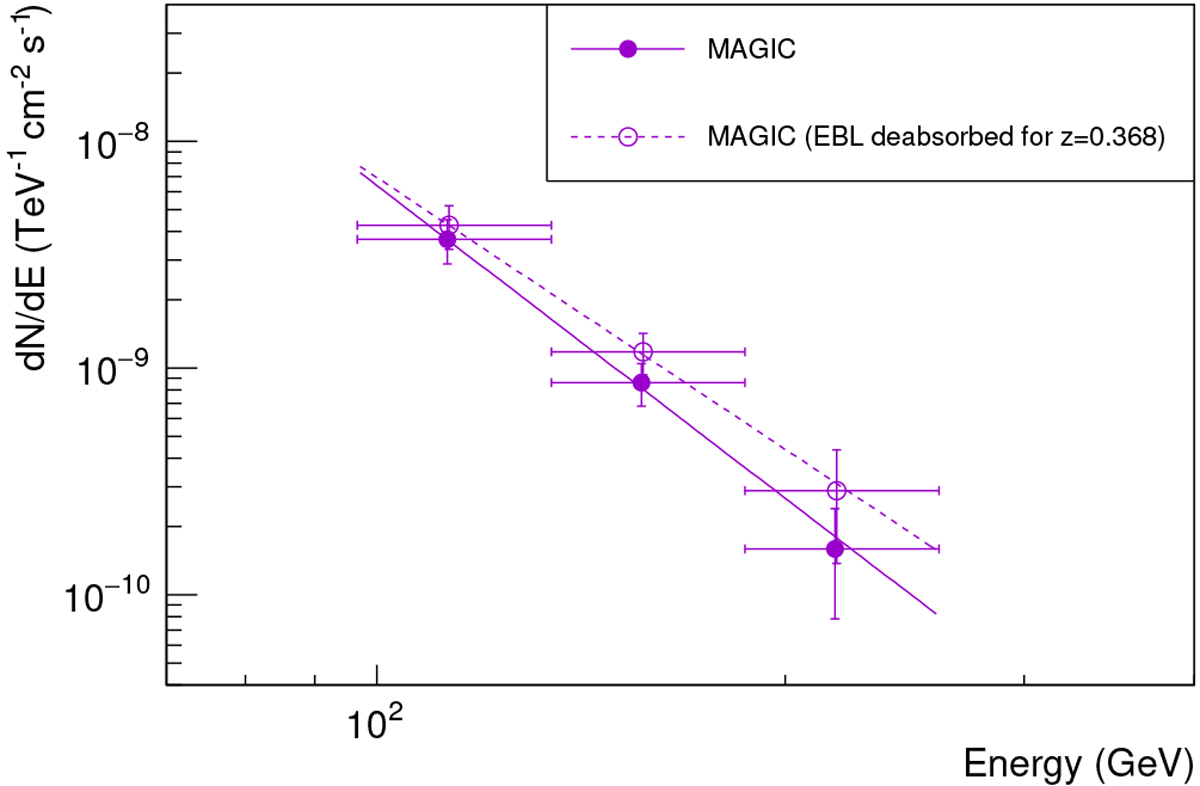
Spectrum for the VHE MAGIC detection. MAGIC data are for flare night only (2015 February 14, MJD 57067.14). Violet filled circles are for the unfolded observed points, while open circles are deabsorbed for EBL absorption (EBL model by Domínguez et al. 2011). The solid line is the fit for the observed points and the dashed line is the fit for the de-absorbed ones, with details in the text.
Current usage metrics show cumulative count of Article Views (full-text article views including HTML views, PDF and ePub downloads, according to the available data) and Abstracts Views on Vision4Press platform.
Data correspond to usage on the plateform after 2015. The current usage metrics is available 48-96 hours after online publication and is updated daily on week days.
Initial download of the metrics may take a while.