Free Access
Fig. 9.
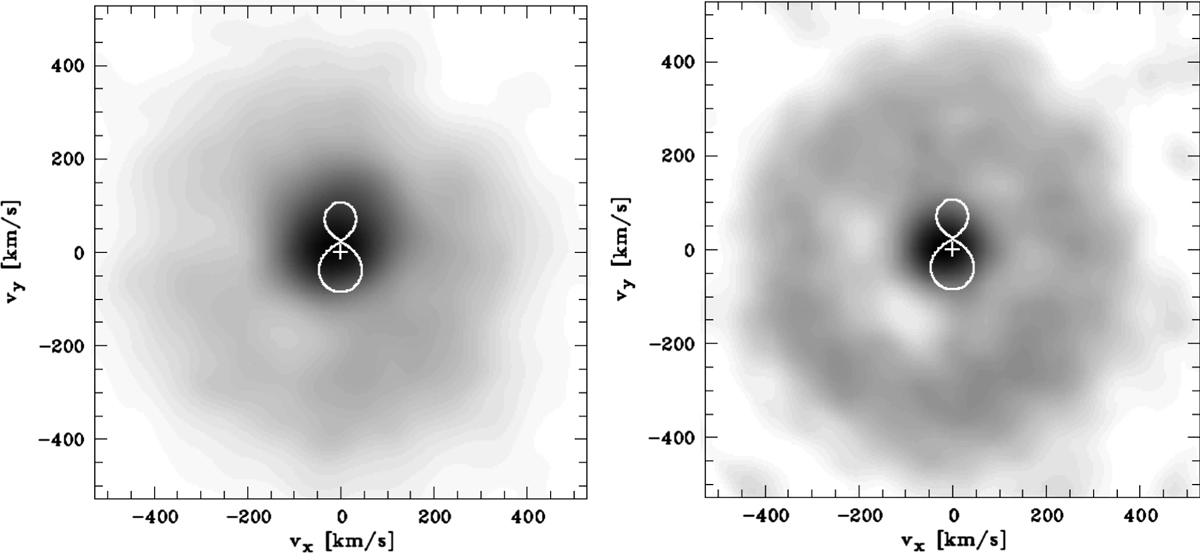
Doppler maps of VY Scl showing the distribution of Hα emission (left plot) and the averaged He I emission (right plot) in velocity coordinates. The white cross marks the centre of rotation. The maps are oriented such that the phase angle is zero towards the top and increases clockwise.
Current usage metrics show cumulative count of Article Views (full-text article views including HTML views, PDF and ePub downloads, according to the available data) and Abstracts Views on Vision4Press platform.
Data correspond to usage on the plateform after 2015. The current usage metrics is available 48-96 hours after online publication and is updated daily on week days.
Initial download of the metrics may take a while.